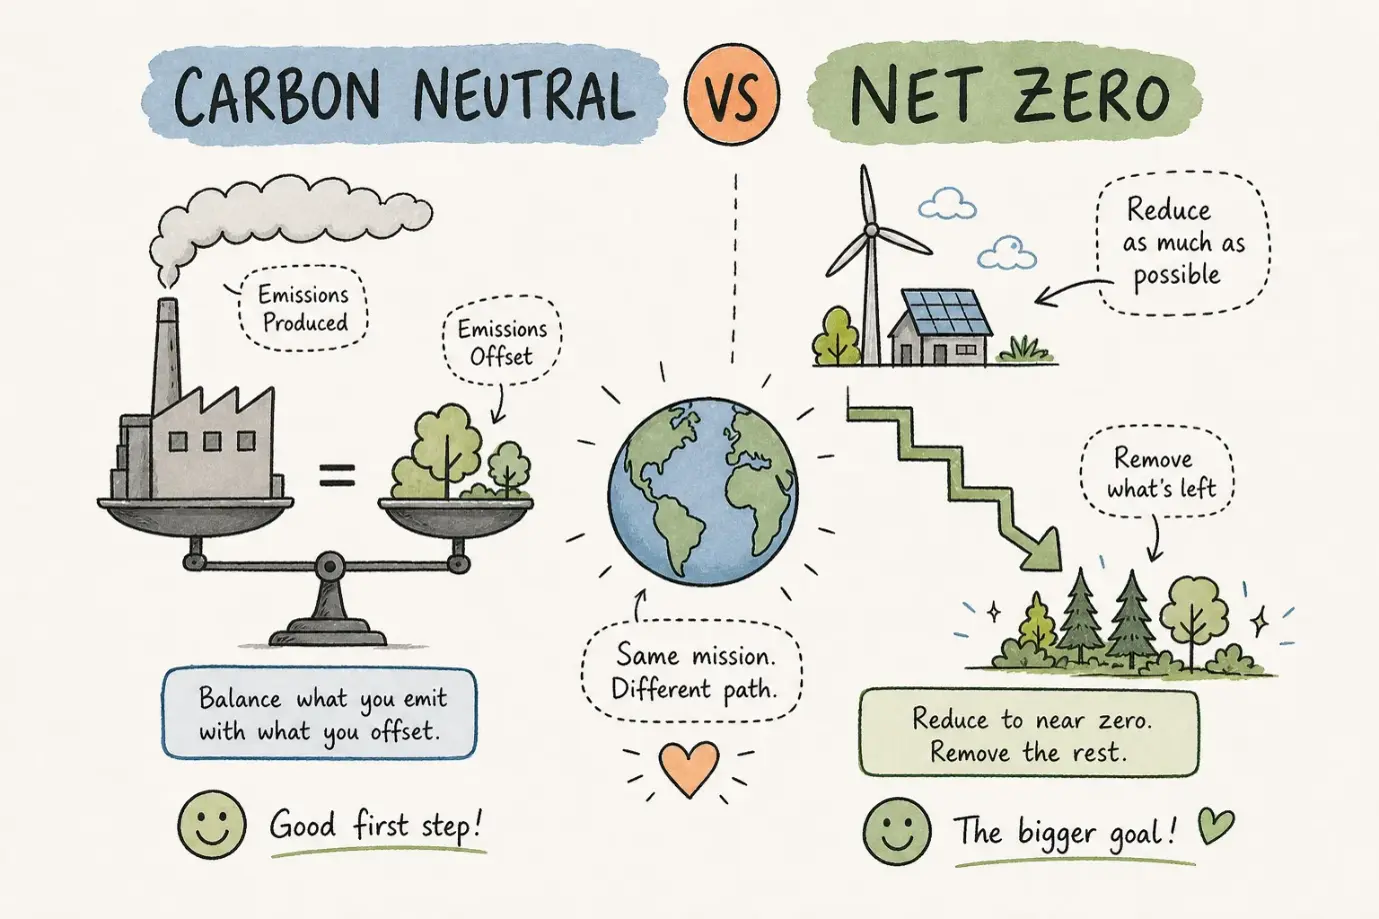
Carbon neutral vs net zero: what’s...
Carbon neutral vs net zero: two terms, both sound green, both are...

Green Passport Carbon , Singapore

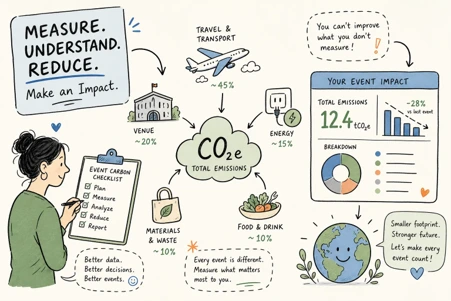
Most event organisers know they should be doing event carbon measurement. The sticking point is never intention. It is the first practical question: where do you actually begin? What data do you collect? From whom? In what units? And how do you turn that data into a number that means something in an ESG report or a client brief?
The good news is that measuring your event’s greenhouse gas emissions is a structured process, not a guesswork exercise. The methodology already exists. Some platforms aim to address Singapore MICE needs specifically, so you are not entirely starting from scratch. What you need is a clear map of that process from source identification through to reportable output.
This guide gives you exactly that. By the end, you will know which emission sources to include, what data to collect and in what units, how to apply emission factors with confidence, which calculator to use, and what to do with your results once you have them.
A complete event greenhouse gas inventory covers six standard categories: attendee travel, venue energy, catering, waste, materials and production, and freight and logistics. Together, they cover the event’s full footprint from first departure to final pack-down.
Attendee travel includes every mode of transport used to get people to and from the venue: flights, taxis, private cars, buses, and trains. Venue energy covers the electricity, heating, and cooling consumed during the event, including fuel used by on-site generators. Catering accounts for the production and preparation of all food and beverages served. Waste covers everything sent to landfill, incineration, recycling, or composting. Materials and production includes stands, signage, printed collateral, décor, and temporary structures. Freight and logistics captures the transport of equipment, builds, and supplies by road, sea, or air.
For most conferences and exhibitions, attendee travel accounts for between 60 and 85 percent of total event emissions. The reason becomes clear when you look at the numbers: air travel typically generates around 0.15 kg CO₂e per passenger-kilometre, while rail generates closer to 0.035 kg CO₂e per passenger-kilometre. A delegate flying in from Europe for a two-day conference in Singapore contributes more to the event’s footprint than everything happening on the conference floor combined. Knowing this before you start collecting data tells you where to focus your effort.
Using the GHG Protocol framework, Scope 1 covers direct emissions from sources the organiser owns or controls, such as on-site fuel combustion or a company-owned generator. Scope 2 covers purchased electricity consumed at the venue. Scope 3 covers all other indirect emissions in the event’s value chain, including attendee travel, accommodation, catering, freight, and materials. Best practice is to include all Scope 1 and Scope 2 emissions, then select Scope 3 categories based on materiality. Where an event has multiple co-organisers, emissions can be allocated using a documented basis such as cost share or attendee share, so each party reports its proportional share rather than the full event total.
Organisers frequently struggle with event carbon measurement not because the arithmetic is difficult, but because they do not know what to request, from whom, and in what form. This section solves that problem directly.
Ask for metered electricity consumption in kilowatt-hours, fuel consumption for heating or generators in litres, waste generated by treatment type in kilograms or tonnes, and the event space size in square metres with total usage duration in hours. Venue invoices and utility bills give the highest accuracy. Avoid using spend as a proxy for energy use, because two venues with identical electricity costs can have very different actual consumption levels depending on tariff structures.
For attendees, collect origin city or country, mode of transport, class of travel, number of hotel nights, and number of meals consumed by diet type. For freight and materials suppliers, request cargo weight in kilograms or tonnes, transport mode, and distance in kilometres. This level of detail is not excessive. It is what allows you to apply the correct emission factor to each activity rather than using a blunt average that can vary substantially across activity types.
The single most important data quality principle in event carbon measurement is this: always collect physical units rather than financial spend. Collect kilowatt-hours instead of energy cost, kilograms instead of “supplies,” passenger-kilometres instead of travel budget, and room-nights instead of hotel spend. Consider a scenario where two events both spend SGD 10,000 on catering. One features a plant-based menu; the other is heavy on beef and dairy. The spend is identical. The carbon footprint is not even close. Physical units remove that ambiguity and produce results that are actually defensible.
Once you have your activity data, the next step is multiplying each figure by the appropriate emission factor to convert it into kilograms of CO₂ equivalent. The quality of those factors determines the credibility of your results.
Venue electricity is the clearest example. Singapore’s national grid emission factor, as published by the Energy Market Authority (EMA), is 0.402 kg CO₂ per kWh for 2024, the latest annual figure available as at October 2026. Readers finalising reports for 2025 or 2026 should check the EMA website for the most recently published value, as the grid factor is updated periodically. Using a generic global average instead of the current local figure will produce a materially different result. The same logic applies to transport: regional road and rail factors reflect local fuel mixes and vehicle fleets more accurately than universal defaults, which is why using locally relevant factors is standard practice in credible event emissions reporting.
Each emission category has its own factor unit. Travel is measured in kg CO₂e per passenger-kilometre, with short-haul air typically around 0.13 to 0.15 kg CO₂e/pkm and rail around 0.035 kg CO₂e/pkm. Venue energy uses kg CO₂e per kWh, applied using the local grid factor. Catering uses kg CO₂e per meal, and this figure is highly sensitive to menu composition: animal-based meals generate materially higher emissions than plant-based alternatives. Waste is measured in kg CO₂e per kilogram by treatment route, with landfill and incineration carrying higher factors than recycling or composting. Materials and freight are measured in kg CO₂e per kilogram or per tonne-kilometre respectively.
Two frameworks underpin credible event emissions reporting: ISO 14068-1 and the GHG Protocol. ISO 14068-1 is the international standard for carbon neutrality claims and superseded PAS 2060, which BSI withdrew at the end of 2025. ISO revised it in September 2026 as ISO 14068:2026, a minor revision that mainly changes the title and removes the part number. Calculations aligned to these standards can be reproducible, reviewable and defensible in sustainability reports. A number produced outside a recognised methodology framework is difficult to defend when a client, auditor, or regulator asks how it was derived.
Not all event carbon calculators are equal, and the differences go beyond price. The right tool for your event depends on your size, your reporting requirements, and whether you need an estimate or a credible, certifiable output.
Free calculators such as myclimate, atmosfair, and SkootEco are useful starting points for quick estimates on small or straightforward events. They are reputable tools and well-suited to one-off calculations where a ballpark figure is sufficient. Paid platforms like TRACE, Climeet, and EventZero offer more structured reporting workflows, multi-user collaboration, and outputs designed for formal sustainability reporting. The tradeoff is not just cost; it is whether the output is auditable, scope-defined, and reportable in the way your clients or ESG framework requires.
Four attributes separate a credible event carbon calculator from a rough estimator. The tool should be aligned to a recognised standard such as ISO 14068-1 or the GHG Protocol. It should cover all six emission categories rather than just travel and energy. It should use local or regionally appropriate emission factors rather than global defaults. And its outputs should be in a format that directly supports ESG reporting or carbon neutrality certification. If a calculator cannot satisfy all four criteria, the number it produces may be useful internally but will not hold up externally.
Green Passport Carbon is a Singapore-based, MICE-specific platform designed for this market. Unlike general-purpose tools built for other markets and adapted for Singapore, the Green Passport Carbon MICE calculator applies methodology informed by recognised carbon-accounting principles and covers flights, accommodation, electricity, food and beverages, and materials in a single structured workflow, producing an indicative planning estimate. That estimate can feed into the company’s Calculate, Retire, and Certify process, where the footprint is reviewed, eligible carbon credits can be retired and a branded Green Passport Carbon certificate is issued, without requiring you to stitch together separate tools, consultants and credit registries. For Singapore event organisers who need a result they can actually use in a report or a client deliverable, that integrated approach is worth evaluating. The calculator itself is free and gives a Free Event Carbon Estimate; the Full Event Carbon Assessment, carbon-credit retirement and the Green Passport Carbon Event Certificate are provided as part of Green Passport Carbon’s quote-based service.
Getting your emissions total opens the real work, not closes it. Act on what the inventory tells you, by emission category, by reduction opportunity, and by what the numbers mean for your reporting obligations.
Interpret your results by emission category first. Identify which sources are largest, where practical reduction is possible, and what the total figure means relative to similar events. A first measurement functions as a baseline. Its primary purpose is to show you where action will have the most impact, not to produce a perfect number. Perfection comes with repeat measurement and better data collection over time; usefulness starts immediately.
The reduction levers with the clearest evidence are waste diversion, catering menu shifts, and venue energy choices. One published festival case study reported 74 percent of waste recovered through structured diversion programmes, alongside 32.7 tonnes of CO₂ saved. Shifting from meat-heavy to plant-based catering reduces emissions per meal significantly, given the difference in embedded carbon between animal-based and plant-based food systems. Travel modal shift carries the largest theoretical impact given how much attendee travel dominates total footprints, but it requires more lead time and stakeholder coordination, particularly for international events.
Reporting-ready output from an event sustainability measurement exercise has four components: a documented methodology, cited emission factor sources, a clear scope boundary statement, and an allocation basis if the event is co-hosted. Calculations that follow recognised methodologies, paired with documented retirement of high-quality carbon credits, support the kind of transparent, well-evidenced output that Singapore ESG and sustainability reports increasingly value. As Singapore’s mandatory climate reporting phases in, with all listed companies reporting Scope 1 and 2 emissions from FY2025 and STI constituents adding Scope 3 from FY2026, the difference between a credible measurement and an undocumented estimate will become more consequential for organisations that host events as part of their annual reporting footprint.
Event carbon measurement follows a clear sequence: identify your six emission sources, collect activity data in physical units, apply locally relevant factors aligned to a recognised methodology, use a calculator that produces reportable output, and act on what the results tell you. None of those steps require specialist knowledge once the process is mapped out. The complexity is mostly in not knowing where to start, and this guide has removed that obstacle.
Green Passport Carbon was built specifically for Singapore event organisers who want to do this properly without assembling the process themselves. The calculator, the credit retirement, and the branded Green Passport Carbon certificate are all part of a single end-to-end process, purpose-built for the MICE sector. The certificate documents the carbon action taken; it is not an ISO certification or an independent third-party verification. If you are ready to move from intention to a credible, reportable result, get in touch with our team to start the process for your next event.
Carbon neutral vs net zero: two terms, both sound green, both are...
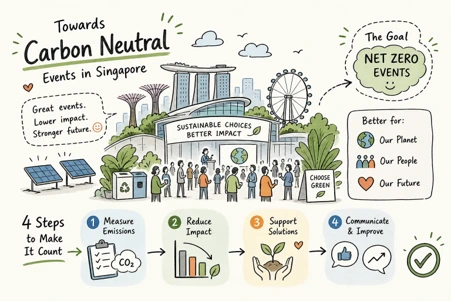
Carbon neutrality claims are increasingly visible in Singapore's events industry. Conference programmes...

Carbon offset solutions for hotel ballrooms and event spaces in Singapore are...
Find quick answers about the Event Carbon Calculator, your emissions estimate, and what happens next.
There is no official threshold. The most cited reference is approximately 14.13 kg CO2 per attendee for venue-related emissions, with energy the dominant contributor. Note this excludes attendee travel, so a full-scope per-attendee figure will typically be higher. Treat it as a comparative benchmark for the venue category rather than a pass mark for the whole event.
Yes. SACEOS has published WA 4: Sustainable MICE — Guidelines for Carbon Emissions Management, a Singapore Standards workspace agreement covering measurement, reduction, calculation, verification and offset. Separately, the Singapore MICE Sustainability Certification (MSC) provides GSTC-Recognised organisational certification, and STB and SACEOS will develop a MICE Decarbonisation Framework by 2028.
Air-conditioning, lighting and audiovisual systems run continuously through operating hours regardless of attendee behaviour, making venue energy a structural and relatively predictable load. In Singapore’s climate, cooling demand is both unavoidable and substantial. This is why the MICE Venue Sustainability Playbook points to emissions per square foot of venue area as a comparable metric.
Yes — and then raised them. By 2025 the original roadmap targets were exceeded, with all purpose-built MICE venues and over 80% of SACEOS member companies certified. Roadmap 2.0, unveiled in July 2026, commits to a MICE Decarbonisation Framework by 2028 and net zero by 2050.
No. MSC certifies the organisation across domains including carbon, waste, energy, water, social responsibility, HR competency and procurement, valid for two years. It does not produce a per-event footprint figure or evidence that a specific event’s emissions were addressed. Those are separate exercises.
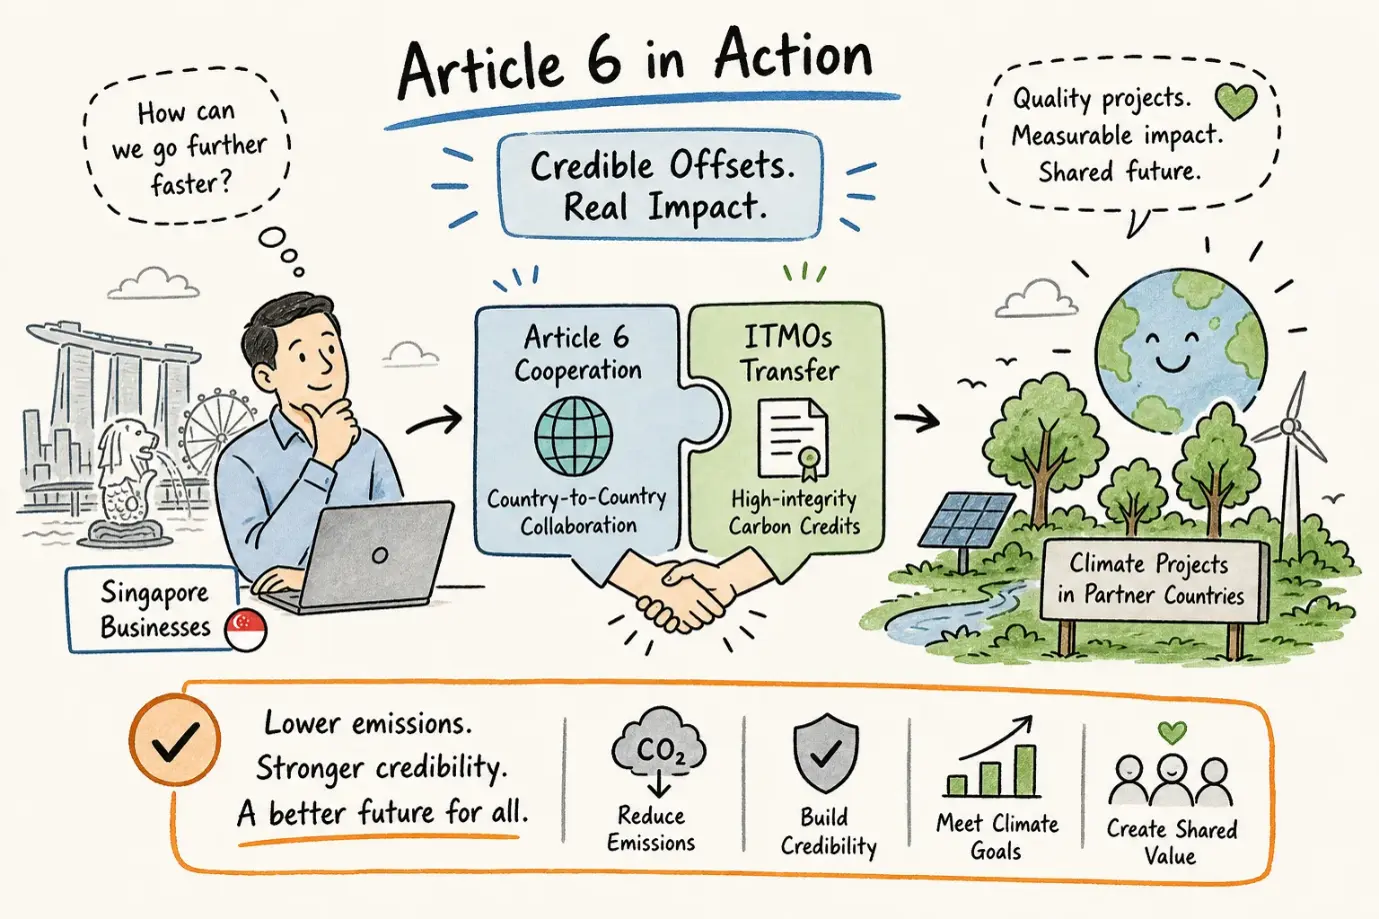
Article 6-aligned offsets are no longer just a conference talking point; they...

Article 6 carbon credits are fundamentally different from standard voluntary offsets, and...
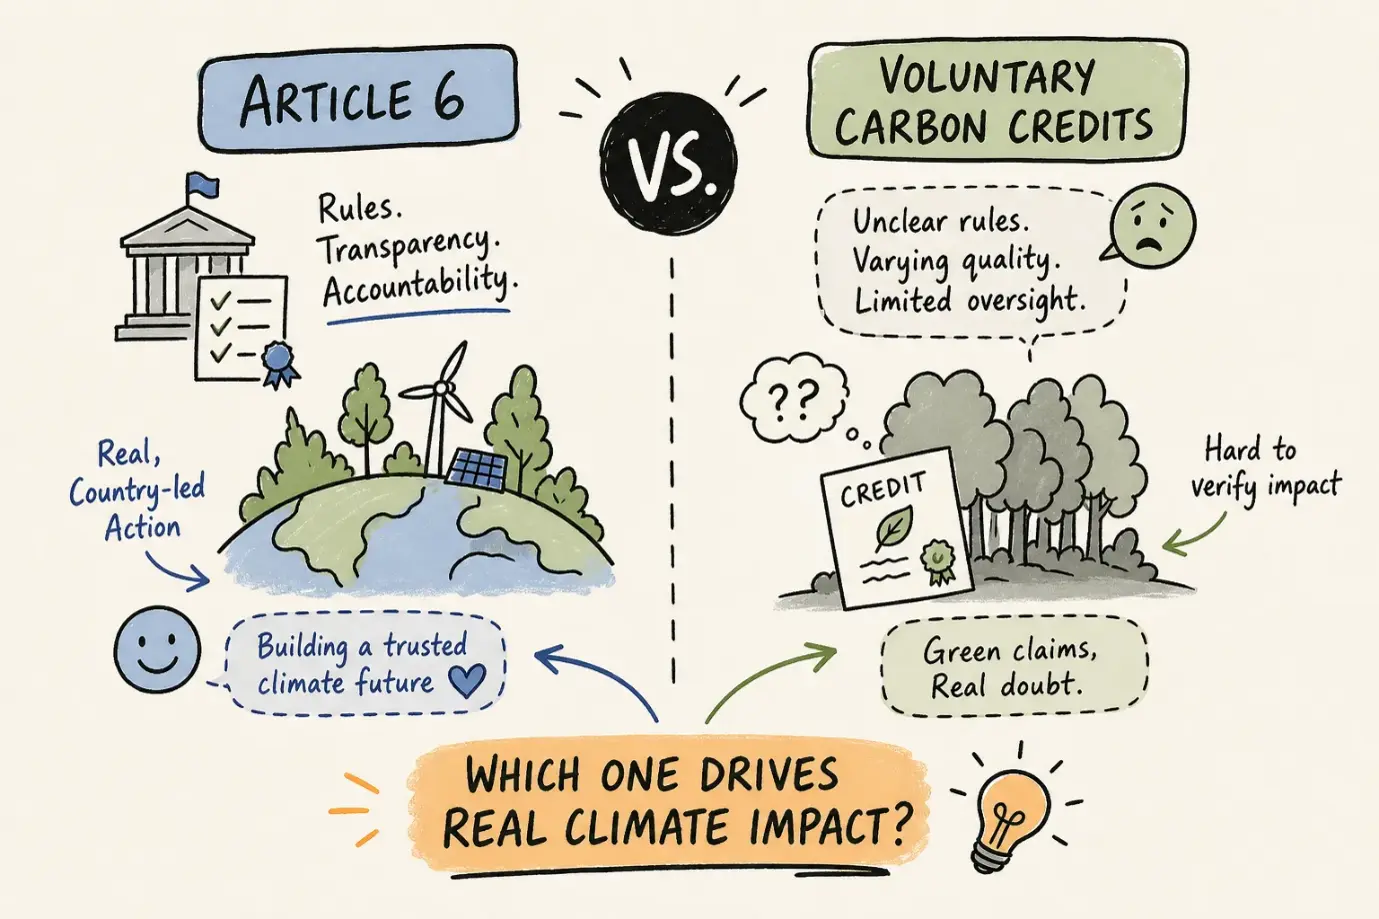
Understanding the difference between Article 6 and voluntary carbon market credits is...
Carbon neutral vs net zero: two terms, both sound green, both are...
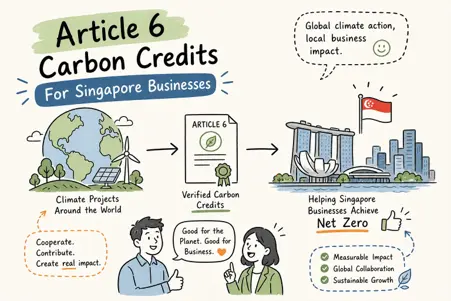
For Singapore businesses, Article 6 carbon credits explained properly can mean the...
Carbon neutrality claims are increasingly visible in Singapore's events industry. Conference programmes...

Green Passport Carbon
Quick Links
More Information
 Optimized by Seraphinite Accelerator