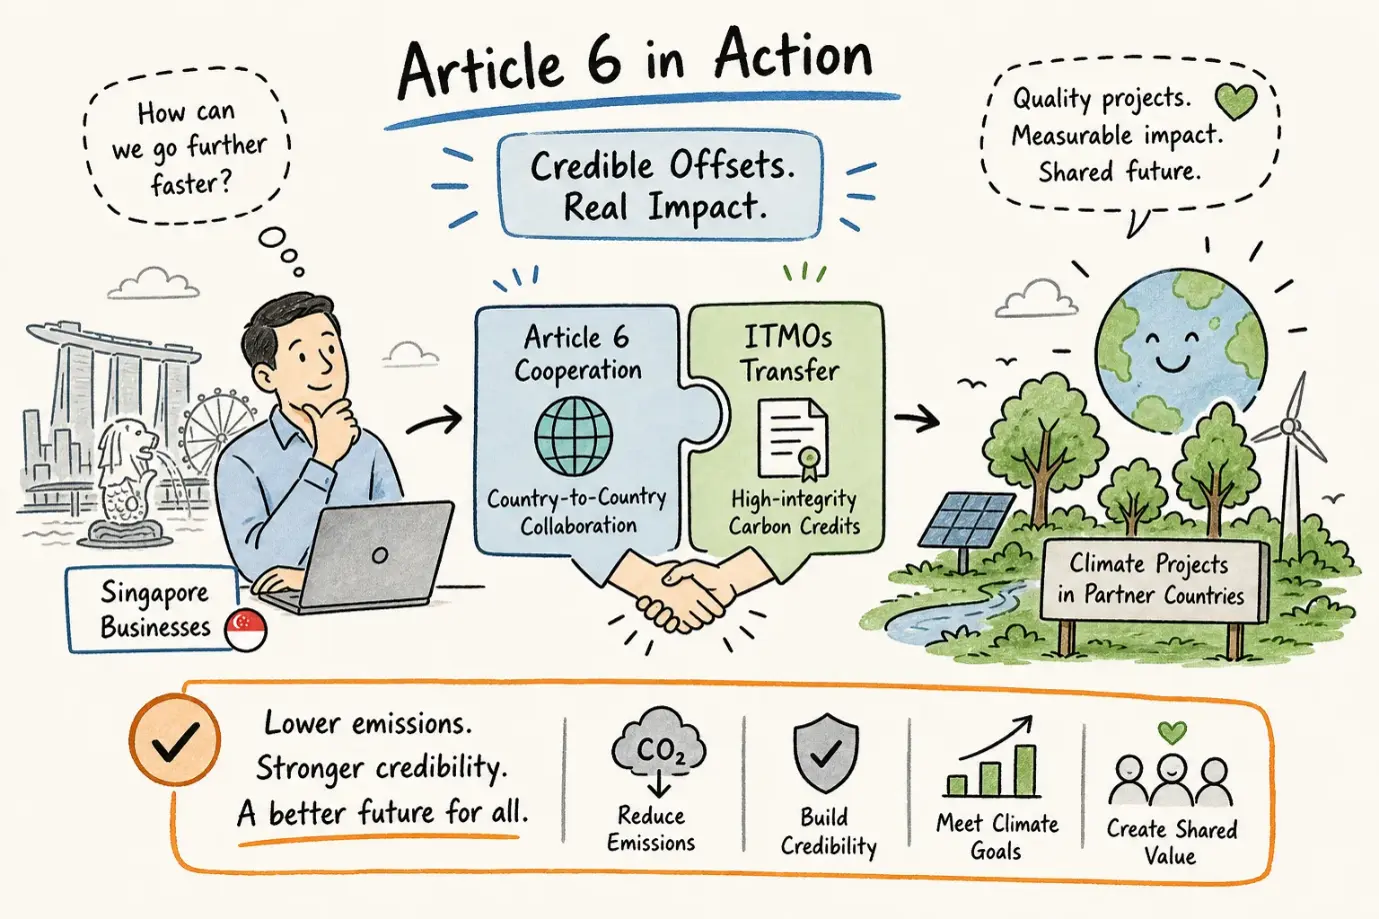
Article 6-aligned offsets explained for Singapore...
Article 6-aligned offsets are no longer just a conference talking point; they...

Green Passport Carbon , Singapore

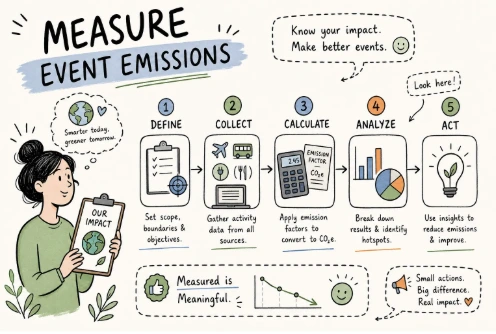
Knowing how to measure event emissions starts with understanding where your event’s carbon footprint actually originates, and the answer will likely surprise you. Attendee travel alone typically accounts for 56, 96% of a conference’s total emissions, yet many event organisers begin their carbon measurement journey by asking about recycling bins. That framing mismatch is costly, both for credibility and for ESG reporting. Getting serious about your event’s carbon footprint means understanding exactly where emissions come from, how to count them, and how to convert raw data into a defensible tCO2e figure that holds up under scrutiny.
This guide walks through the full process of measuring event emissions: from drawing your boundary, to collecting data from attendees and suppliers, to applying the right emission factors, to choosing a calculator that handles the heavy lifting. For Singapore MICE events in particular, tools like Green Passport Carbon’s event carbon calculator are purpose-built to support this process. Understanding the methodology behind the numbers is what makes any output credible in the first place.
Without a clear boundary, your carbon figure is just a guess. The boundary defines what your event footprint includes and excludes, and it is the single most important decision you make before any data collection begins. Every credible event carbon inventory documents this upfront, because two organisers can produce wildly different numbers for the same event simply by drawing the boundary in different places.
What typically falls inside the boundary: venue energy, attendee travel, staff and speaker travel, accommodation, freight and logistics, catering, event materials, and waste. What is commonly and legitimately excluded: upstream manufacturing of the venue infrastructure, and personal spending by attendees outside the event programme. The key principle is that consistency matters more than perfection. Whatever you include or exclude must be documented and defensible.
Mapping each activity to the correct scope keeps your inventory clean and avoids double-counting. Scope 1 covers direct emissions under organiser control: on-site generators, fuel burned for event operations, and refrigerant leaks from hired equipment. Scope 2 covers purchased electricity and cooling drawn from the venue’s grid connection. Scope 3 covers everything else, in practice, attendee travel, accommodation, catering supply chain, freight, and waste disposal.
For most events, Scope 3 is where the vast majority of emissions sit. This is precisely why attendee travel data collection is non-negotiable, not a nice-to-have. If your data collection plan treats venue energy as the priority and leaves travel as an estimate, your inventory will be structurally flawed from the outset.
Once the boundary is set, you need to know where to focus your data collection effort. Peer-reviewed studies and industry research point consistently to the same five categories: travel, venue energy, accommodation, catering, and waste. Understanding the relative size of each tells you where to invest your time getting accurate data.
Travel accounts for approximately 80% or more of emissions for fully in-person academic conferences, and between 50, 63% in broader MICE event inventories, though the range can be wider depending on the proportion of international attendees. For Singapore events drawing international attendees from Europe, North America, or the Middle East, those long-haul flights carry a significant per-passenger emissions load, particularly when business class travel is involved. According to DEFRA 2025 published factors, a long-haul business class seat carries roughly 2.7 times the emissions per kilometre compared to economy, because of the greater cabin space allocated per passenger.
Ground transport and multi-day accommodation function as connected travel costs and should be counted alongside flights rather than in a separate category. An attendee flying from London to Singapore for a three-day conference accumulates emissions not just from the flight, but from the hotel stay and local transfers as well.
Venue energy typically sits in the low single digits to under 10% of total event emissions, but it is the most straightforward category to measure accurately because it comes from a utility meter. Singapore’s grid emission factor is 0.402 kg CO2e per kWh for the 2024 data year, published by the Energy Market Authority and referenced through the Singapore Emission Factors Registry (SEFR). Readers should verify whether updated 2025 or 2026 figures have since been published by EMA before applying this value.
Catering ranges from roughly 7, 16% of total emissions in MICE event studies, with vegetarian menus producing meaningfully lower figures than meat-heavy options: approximately 0.39 kg CO2e per serving versus 0.84 kg CO2e for meat-based dishes, based on Asian recipe datasets. Waste is typically below 1% of total emissions in most conference settings and, while worth measuring for completeness, is rarely a material lever for reduction, though events with very high food waste or material-intensive exhibitions may see higher proportions.
The quality of a carbon measurement is directly determined by the quality of the underlying data. Estimating where you cannot measure is sometimes unavoidable, but the goal is to replace estimates with primary data wherever the category is large enough to matter. The two main collection tasks are gathering travel and accommodation data from attendees, and obtaining operational data from venues and suppliers.
Every organiser needs three data points for travel: origin city or country, travel mode, and class of travel for flights. Practical collection methods include registration form fields asking for home city and intended travel mode, post-event travel surveys for events where pre-registration data is limited, or pre-event booking data if travel is managed centrally through a corporate travel programme. For accommodation, you need room nights and ideally the specific hotel property, because carbon intensity varies significantly between a budget property and a convention hotel with a published emissions factor. A note that says “hotel stay” is not usable data.
From the venue, request metered electricity consumption in kWh for the event period, any separately metered heating or cooling, and fuel consumption for on-site generators. From catering suppliers, the minimum usable input is meal count by menu type: knowing whether 500 meals were vegetarian or meat-heavy makes a real difference to the calculation. For waste, you need volume or weight by disposal route, landfill, recycling, or composting. Request all of these figures in writing from suppliers. Primary data from suppliers carries more credibility than estimates in any GHG Protocol or ISO 14064-1-aligned inventory, and having it in writing means you can document the source when ESG teams or auditors ask questions later.
With data in hand, the calculation follows a straightforward formula. The challenge is not the maths; it is selecting the right emission factors and avoiding the errors that undermine the result.
Emission factors are the conversion coefficients that translate raw activity data into kg CO2e. For Singapore electricity, use EMA’s published grid factor: 0.402 kg CO2e per kWh for the 2024 data year, available through the Singapore Emission Factors Registry. For flight emissions, DEFRA’s 2025 published factors are the standard reference, with separate values for short-haul and long-haul, and for economy versus business class. The DEFRA 2025 long-haul economy factor including radiative forcing is 0.15282 kg CO2e per passenger-kilometre; the long-haul business class factor rises to 0.41077 kg CO2e per passenger-kilometre. For catering and waste, Singapore-specific factors are limited, and practitioners typically use UK DEFRA or IPCC-derived fallback factors with clear documentation of the source and year. Always verify whether more recent emission factor vintages are available before finalising your inventory.
The core formula is straightforward: Emissions (kg CO2e) = Activity Data × Emission Factor. As a worked example for a Singapore MICE context: 200 attendees flying from London to Singapore in economy class, at approximately 10,800 km per journey, multiplied by the DEFRA 2025 long-haul economy factor of 0.15282 kg CO2e per passenger-kilometre, produces roughly 1,651 kg CO2e (approximately 1.65 tCO2e) per passenger, or around 330 tCO2e in total for that travel segment across all 200 attendees.
Two errors consistently undermine event carbon calculations. The first is forgetting to apply a radiative forcing uplift for aviation, which some methodologies require to account for the warming effect of contrails and high-altitude emissions. The second is mixing location-based and market-based electricity factors within the same inventory. Once all categories are calculated, sum them to a total tCO2e figure and express that as a per-attendee intensity metric. That ratio is what allows you to benchmark against comparable events and model reduction scenarios.
Doing this manually for every event is time-consuming and error-prone. Several purpose-built event emissions calculators exist, including Green Events Tool, myclimate, EventZero, Skoot Eco, and Climeet, but they vary significantly in coverage, methodology, and suitability for Singapore MICE events.
The differences that matter for compliance and ESG reporting come down to four things: input coverage (does the tool handle catering and freight, or just travel?), scope attribution (does it separate Scope 1, 2, and 3?), emission factor transparency (are factors documented and current?), and output format (does it produce a report suitable for ESG submission?). Most generic calculators focus heavily on travel and produce a single carbon number with limited documentation. That is useful for awareness, but it does not meet the evidence standard required for a credible neutrality claim or sustainability disclosure.
Green Passport Carbon’s event carbon calculator is purpose-built for the Singapore MICE context. The tool covers all five emission categories, applies current Singapore emission factors, and separates emissions by scope. For organisers who need their measurement to support a carbon neutrality claim or ESG disclosure, a calculator with documented methodology and transparent emission factor sources reduces the compliance burden considerably. This is particularly relevant given Singapore’s Green Plan 2030 sustainability agenda and the growing scrutiny from corporates and sponsors on the credibility of event sustainability claims. Using a calculator that documents its methodology and emission factor sources is not optional when verification is on the table.
Calculating emissions is only the first step. How you document and present the results determines whether the figure is useful for internal decisions, external reporting, or certification. A number without supporting documentation is not an inventory; it is a claim.
Every credible event carbon footprint report needs to show its workings: what was included, what was excluded and why, which data came from primary sources versus estimates, and which emission factors were used with their references and vintage year. This transparency is not optional. ISO 14068-1 and GHG Protocol guidance both require it, and ESG auditors specifically look for it. A calculator that generates a structured PDF summary with this documentation built in saves organisers significant time when sustainability teams or external reviewers ask questions.
Once the tCO2e figure is established and documented, it becomes the foundation for everything that follows. Organisers can use it to identify the highest-leverage reduction opportunities, retire Article 6-aligned carbon credits to offset residual emissions, and obtain a certified carbon neutrality certificate that supports ESG communications. Green Passport Carbon’s end-to-end workflow, Calculate, Retire, and Certify, is designed so that the measurement output feeds directly into the offset and certification stage. The data you collect and the report you generate do not need to be reconstructed or reformatted at the next step. It is a single integrated workflow.
The core process for event sustainability measurement comes down to six steps: define your boundary, map your five emission categories, collect primary data from attendees and suppliers, apply the right emission factors, convert everything to tCO2e, and document your assumptions. Measuring event emissions is not as complex as it looks once you have the right structure in place.
The biggest mistake is waiting until after the event to start thinking about data collection. Attendee travel data is far easier to gather through a registration form than through a post-event survey. Venue energy data is easier to request before the venue resets its metering. The measurement process starts before the event does.
For Singapore event organisers who want to skip the manual process, Green Passport Carbon’s event carbon calculator automates event emissions reporting, applies locally relevant emission factors, and produces structured outputs ready for ESG reporting and certification. Get started with the calculator and have a verified tCO2e figure ready before your next event closes.
Article 6-aligned offsets are no longer just a conference talking point; they...
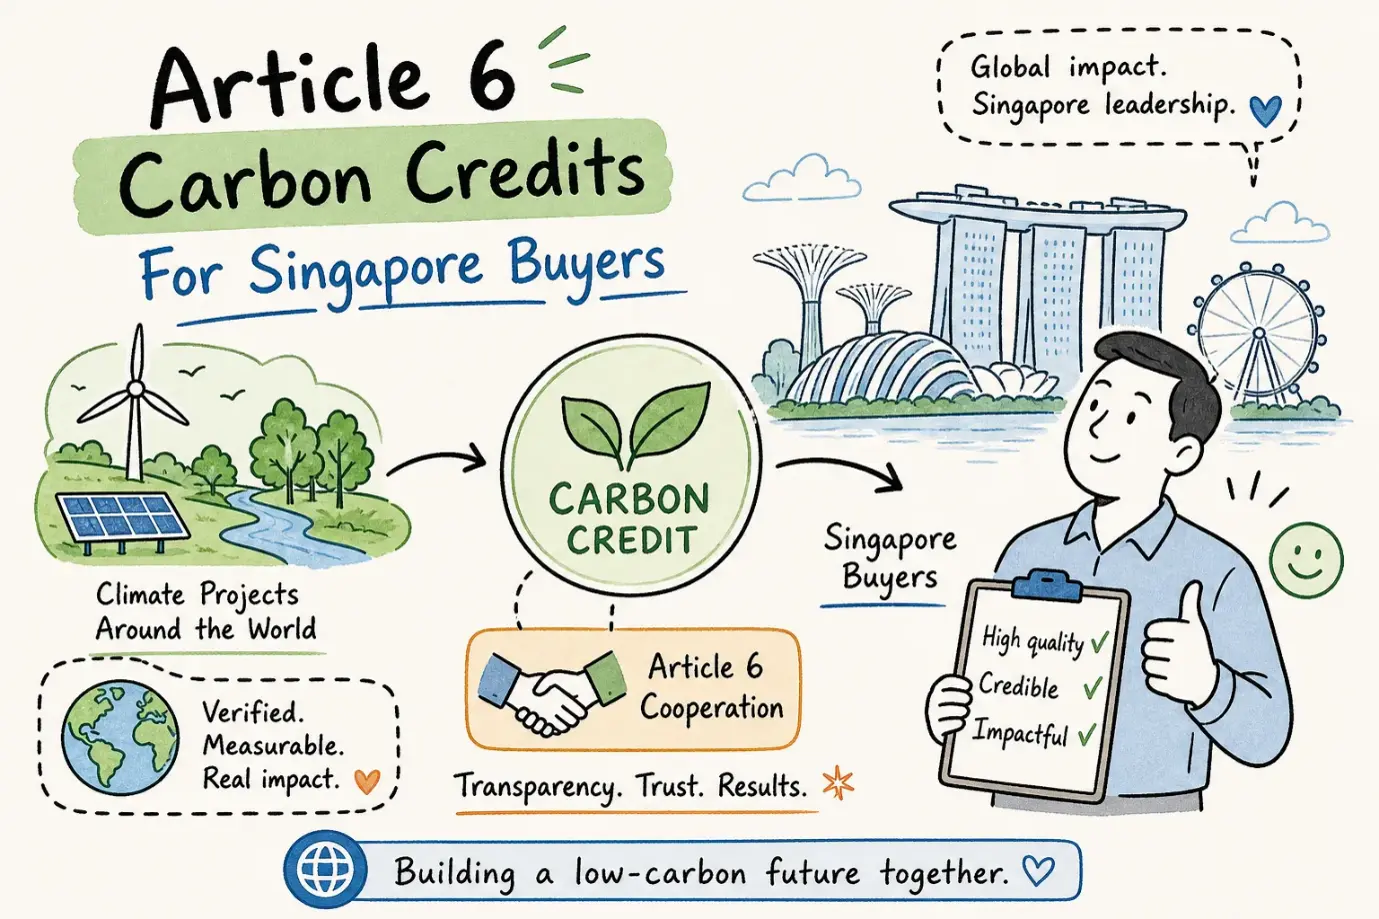
Article 6 carbon credits are fundamentally different from standard voluntary offsets, and...
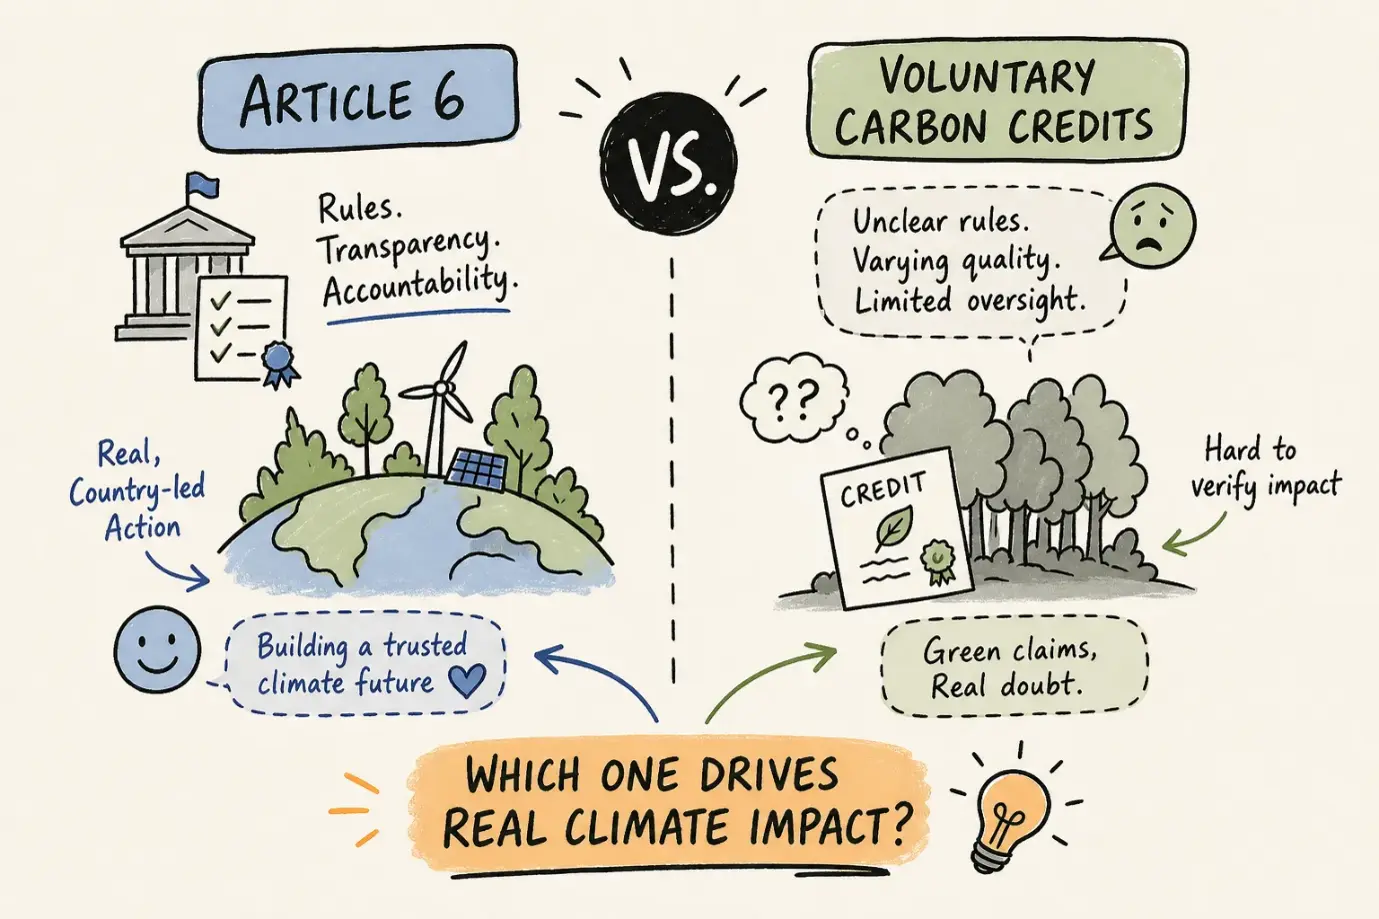
Understanding the difference between Article 6 and voluntary carbon market credits is...
Article 6-aligned offsets are no longer just a conference talking point; they...
Article 6 carbon credits are fundamentally different from standard voluntary offsets, and...
Understanding the difference between Article 6 and voluntary carbon market credits is...
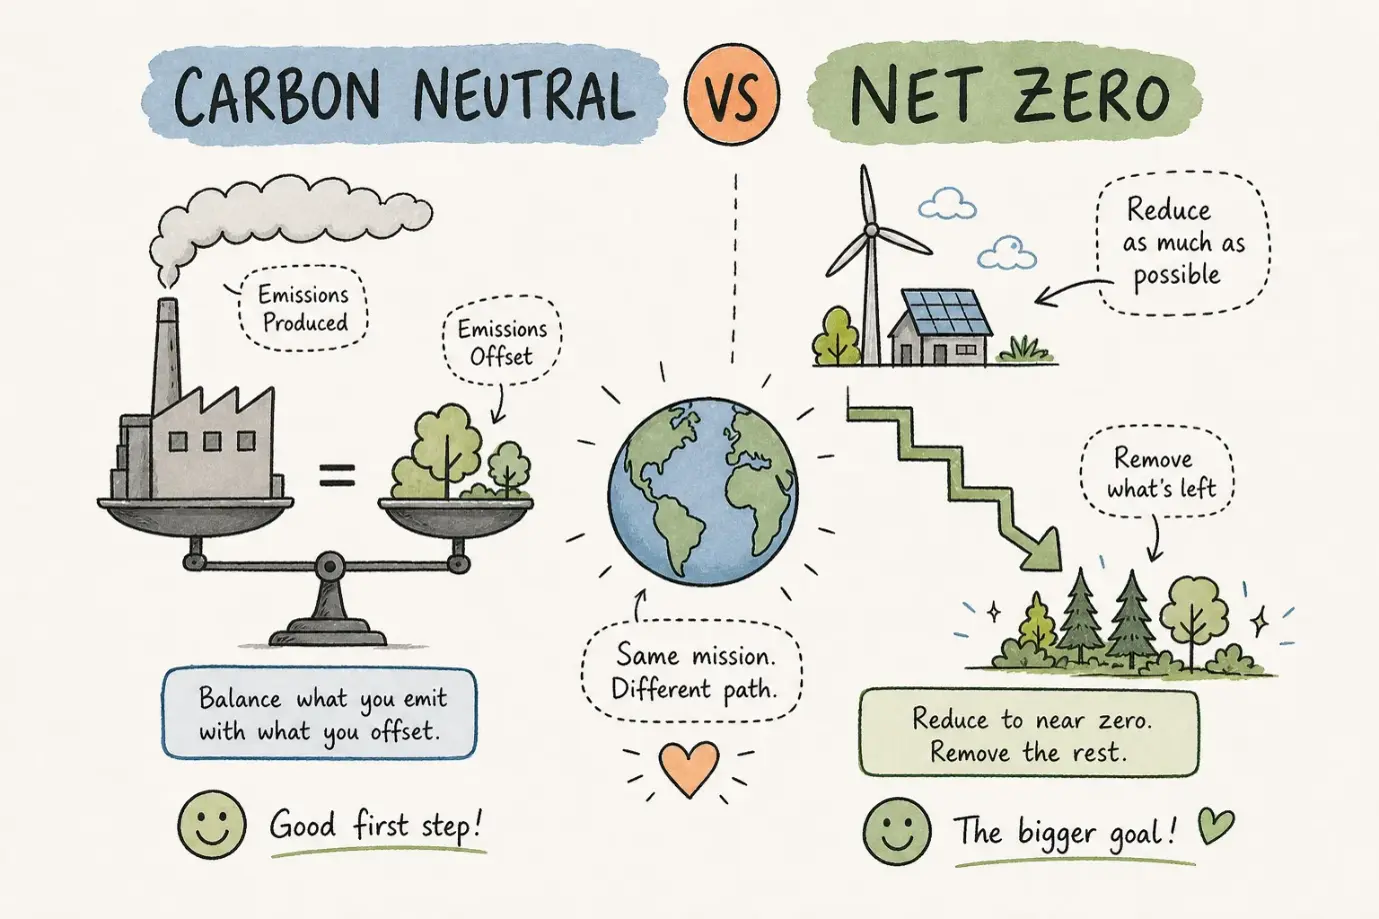
Carbon neutral vs net zero: two terms, both sound green, both are...
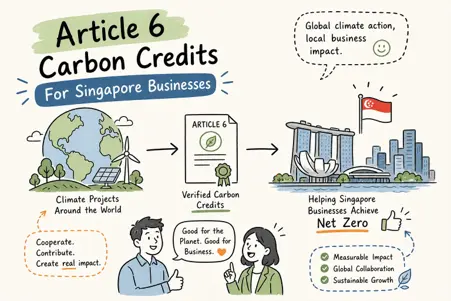
For Singapore businesses, Article 6 carbon credits explained properly can mean the...
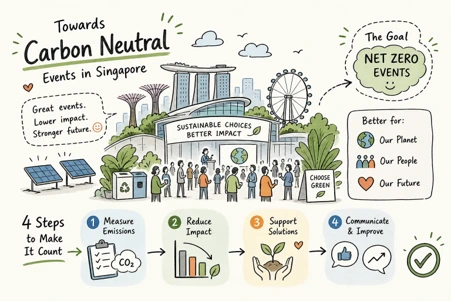
Carbon neutrality claims are increasingly visible in Singapore's events industry. Conference programmes...

Green Passport Carbon
Quick Links
More Information
 Optimized by Seraphinite Accelerator