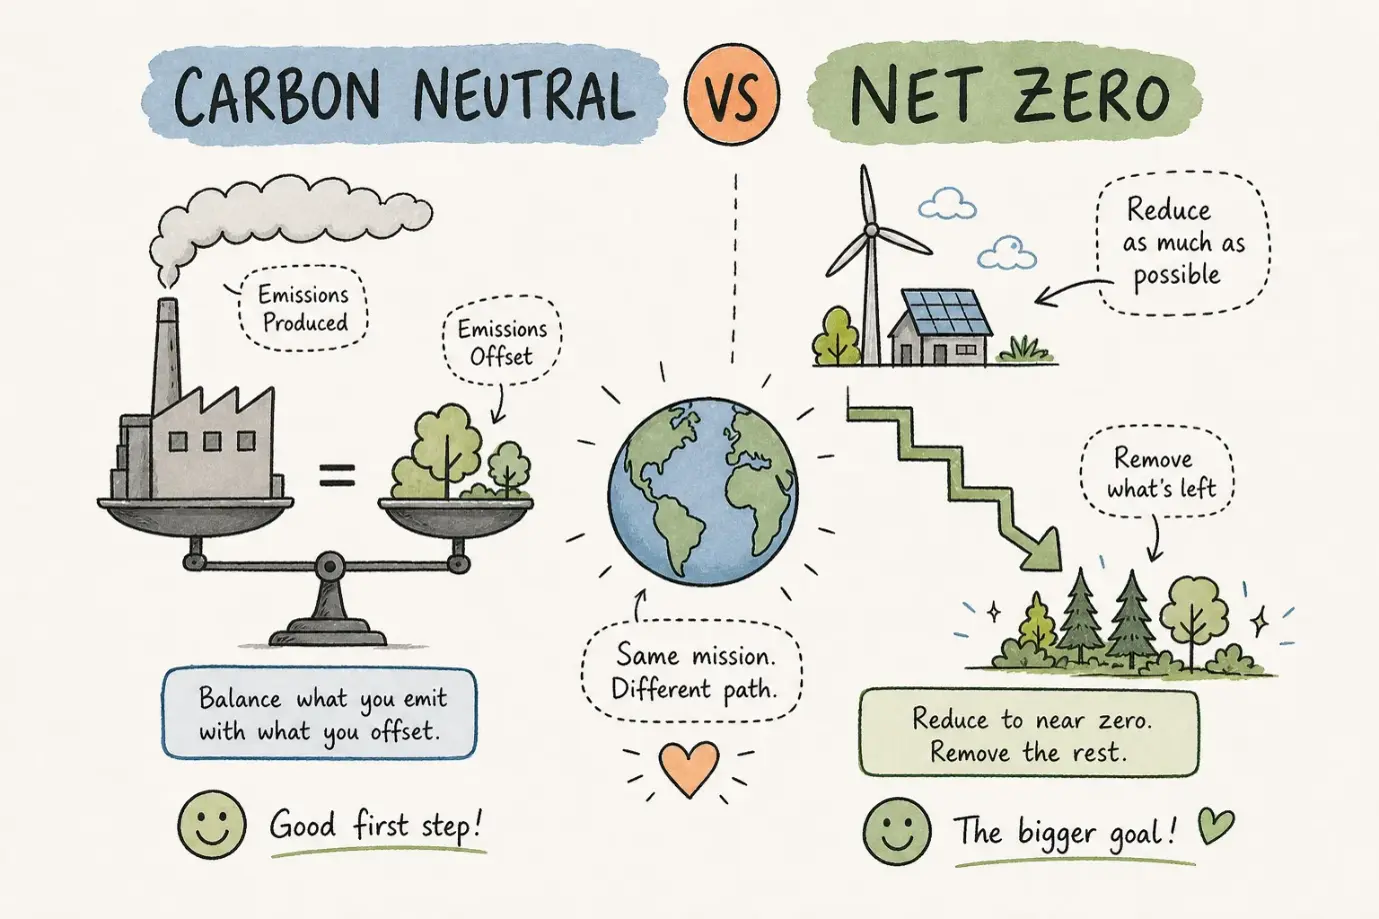
Carbon neutral vs net zero: what’s...
Carbon neutral vs net zero: two terms, both sound green, both are...

Green Passport Carbon , Singapore

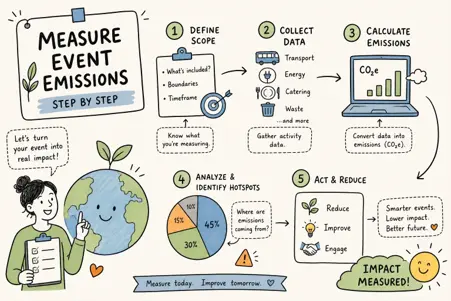
This step-by-step guide to measuring event emissions breaks the process into six concrete stages so that any event organiser, not just environmental consultants, can produce a credible, defensible carbon footprint. When someone tells you to “measure your event’s carbon footprint,” the instruction feels abstract until you have a clear sequence of tasks and a defined starting point. This guide gives you that sequence.
The process has a reputation for being the exclusive territory of spreadsheet specialists. That reputation is not entirely deserved. The underlying logic is straightforward: define what is included, list what generates emissions, collect the numbers, apply the right factors, and document how you got there. Every credible methodology follows some version of this sequence, including the approach built into Green Passport Carbon’s event carbon calculator, which was developed for Singapore’s MICE context so organisers can move from this guide directly into a working calculation.
This guide covers six stages in order: setting your emission boundaries, mapping your emission sources, collecting activity data, applying emission factors with a worked example, documenting your assumptions, and choosing the right tool to hold the process together at scale.
Boundary-setting is often the most overlooked step in event carbon accounting, and it causes the most problems downstream. Without deciding upfront what is “in” and what is “out” of your inventory, you will either double-count sources or miss them entirely, and there is no way to catch the error later without rebuilding the whole calculation.
The most practical boundary approach for events is operational control: if you control the activity, it sits within your boundary. This maps cleanly onto the three greenhouse gas scopes. Scope 1 covers direct emissions from sources you own or control, such as an onsite generator running on diesel. Scope 2 covers purchased electricity at the venue where you have operational control over that consumption. Scope 3 covers everything in the value chain outside your direct control: attendee travel to and from the event, hotel stays, catering supply chains, materials freight, and waste disposal.
For most event organisers, Scope 3 is where the overwhelming majority of emissions sit. Attendee travel, particularly long-haul flights for international conferences, is typically the largest single contributor to a total event footprint. That is why data collection in Step 3 focuses so heavily on travel and accommodation.
Not every source needs to be included, especially if data is genuinely unavailable or the source falls below a reasonable materiality threshold. What you cannot do is exclude something silently. Any exclusion must be documented with a clear reason: data unavailability, an activity outside your operational control, or a source assessed as not material to the total footprint. Standards for carbon neutrality claims, including ISO 14068-1, require explicit disclosure of inclusions and exclusions. Green Passport Carbon’s methodology is built around this same principle; the documentation requirement is not an afterthought, it is embedded in the process from the start.
With your boundary defined, the next task is listing every activity within that boundary that generates emissions. Think of this as the skeleton of your inventory: you are identifying the categories before you attach any data to them. Completeness matters here. Leaving out a major source, such as air travel for a regional conference, will produce a footprint figure that significantly understates your actual impact.
The six standard categories for conferences and exhibitions are:
• Travel: attendee, speaker, staff, and exhibitor travel by all modes (air, rail, car, taxi, shuttle, and coach)
• Accommodation: hotel nights for attendees, speakers, and contractors
• Venue energy: electricity, heating, cooling, and any onsite generator fuel
• Catering: total meals served, menu composition (meat-heavy versus plant-based), and packaging
• Materials and procurement: printed collateral, signage, merchandise, and freight
• Waste: total waste generated, split by disposal route, landfill, recycling, and composting
For virtual or hybrid events, add ICT emissions to this list: participant devices, streaming infrastructure, and data centre energy. If your event has any online component, even a livestream, those emissions are real and measurable.
Prioritise your data collection effort by focusing on the highest-impact categories first. For most MICE events, travel and accommodation are the dominant sources. Venue energy and catering are typically next. Waste and printed materials usually contribute a smaller share. Tackle the high-impact categories first, especially if this is your first measurement exercise.
This is the stage where most first-time measurers stall. The data usually exists; the difficulty is knowing exactly what to ask for and from whom. Being specific in your requests saves enormous time compared with going back to venues and caterers with follow-up questions.
From your venue, request the total electricity consumption in kilowatt-hours (kWh) for the event period, any heating or cooling fuel data, and confirmation of whether the venue uses renewable energy. Metre-read data is the gold standard; venue estimates are acceptable provided they are documented alongside the method used to derive them.
From your caterer, request the total number of meals served, a breakdown of meal types (the proportion that is meat-based versus vegetarian), and quantities of disposable packaging or serviceware.
From your waste contractor, request total waste in kilograms or tonnes, split by stream: general waste, recycling, and food waste or composting.
The most reliable method is to collect travel information at the point of registration, not after the event. Ask attendees for their origin city or postcode, their mode of transport, and whether their trip is return. For international events where flights are expected, also ask for cabin class, the difference in emission factors between economy and business class is substantial. Design the registration form with fixed-choice transport options so the data arrives in a usable format, rather than free-text responses that require cleaning.
Where post-event data collection is unavoidable, survey a representative sample and extrapolate to the full attendee count. For accommodation, collect hotel nights booked through the official event block, or use a short survey asking attendees about their stay duration and accommodation type. The goal is a credible estimate, not perfect data, but the estimate must be documented as such.
With activity data in hand, the calculation follows a simple formula: Activity Data multiplied by the Emission Factor equals CO₂e emissions. Apply this to every source in your inventory, then sum the totals. The output is expressed in CO₂e (carbon dioxide equivalent), the standard unit that accounts for all greenhouse gases, not just CO₂, on a common scale.
For authoritative emission factors, the key sources are UK Defra’s annual greenhouse gas conversion factors (widely used internationally), the GHG Protocol’s cross-sector tools workbook, and the IEA Emissions Factors dataset for country-specific electricity grids. For Singapore specifically, the Energy Market Authority (EMA) publishes the national grid emission factor annually, always check the EMA website for the latest published figure, as it is updated each year. The most recently published factor, for 2024 and still the latest as at October 2026, is 0.402 kgCO₂ per kWh; verify this against the current EMA publication before use.
The following calculation uses illustrative emission factors. A real calculation applies location- and activity-specific factors from the sources listed above.
Attendee travel: 120 attendees by car, 50 km round trip, at 0.180 kgCO₂e per passenger-km = 1,080 kgCO₂e. 80 attendees by rail, 50 km round trip, at 0.041 kgCO₂e per passenger-km = 164 kgCO₂e. Travel subtotal: 1,244 kgCO₂e, the largest single category in this example, consistent with travel being the dominant source for most events.
Venue energy: 1,500 kWh at 0.40 kgCO₂e per kWh = 600 kgCO₂e.
Catering: 200 meals at 2.5 kgCO₂e per meal = 500 kgCO₂e.
Waste: 120 kg at 0.25 kgCO₂e per kg = 30 kgCO₂e.
Total: 2,374 kgCO₂e, or 2.374 tCO₂e for the event. Divided by 200 attendees, that is 11.87 kgCO₂e per person.
One unit conversion to watch: activity data arrives in mixed formats, fuel volumes in litres, energy in kWh, travel in passenger-kilometres, food in meal counts, and waste in kilograms. The final step in every calculation is dividing the kgCO₂e total by 1,000 to express the result in tonnes, which is the standard reporting unit for ESG disclosures and carbon certificates.
A carbon footprint figure without documented assumptions is not credible for ESG reporting, client disclosure, or certification purposes. The number means nothing unless the reader can see how you produced it. An assumption log is not bureaucratic overhead, it is what separates a credible emissions report from a number on a slide.
A solid emissions report includes: total emissions in tCO₂e broken down by category (travel, venue, catering, accommodation, waste); the per-attendee figure for benchmarking; emission factors used with source citations and version years; a clear statement of what is included and excluded from the boundary; and any estimation methods applied where primary data was unavailable.
The per-attendee figure is the most useful metric for year-on-year tracking. If event size fluctuates between years, the absolute total footprint will move with headcount. The per-attendee figure normalises the footprint so you can see whether your sustainability initiatives are actually reducing emissions intensity, or simply whether the event got smaller. Corporate clients and sponsors also request this figure as part of their own Scope 3 reporting obligations under annual sustainability disclosures, making it a practical deliverable beyond internal tracking.
Working through this process manually in a spreadsheet is achievable for a single event. The real risk is not arithmetic errors, it is missing a category, applying an outdated emission factor, or failing to document an assumption that an auditor later questions. Those gaps only become apparent when someone scrutinises the methodology, which is precisely the moment you can least afford a credibility problem.
Green Passport Carbon’s event carbon calculator follows the same logic covered in this guide: data inputs by category (flights, accommodation, electricity, food and beverages, and materials), automatic emission factor application, and a categorised estimate ready for review and documentation. Organisers do not need to source emission factors independently or build formulas from scratch. According to Green Passport Carbon, the tool’s methodology is informed by recognised carbon-accounting principles and built for Singapore’s MICE context; its results are an indicative estimate rather than a final verified or certified footprint. Refer to its methodology page for full details.
For event organisers running multiple events per year, a consistent methodology also produces comparable results across events. That comparability is impossible when every calculation is built differently in a different spreadsheet by a different team member. Consistency is what makes your sustainability data useful for trend reporting, not just single-event disclosure.
Once the calculation is complete through Green Passport Carbon’s platform, and the estimate is reviewed in a Full Event Carbon Assessment, the process moves into the next two stages: retirement of eligible carbon credits with documented retirement records, and issuance of a branded Green Passport Carbon certificate with a unique certificate ID and verification link. The certificate documents the carbon action taken; it is not an ISO certification or an independent third-party verification. The measurement step covered in this guide is the starting point of that three-stage process: Calculate, Retire, Certify. A footprint figure without a clear path to action leaves you with data but no credible story to bring to stakeholders or ESG reporting teams. The calculator itself is free and gives a Free Event Carbon Estimate; the Full Event Carbon Assessment, carbon-credit retirement and the Green Passport Carbon Event Certificate are provided as part of Green Passport Carbon’s quote-based service.
Following a step-by-step guide to measuring event emissions gives organisers a defensible path to a complete footprint, and it becomes significantly faster from the second event onwards. The first time takes longest because you are building the process from scratch: establishing supplier contacts, designing registration questions, and locating emission factor sources. Once those systems are in place, you will know exactly what to ask, who to ask it from, and where the biggest reduction opportunities lie.
Measurement is not a one-time exercise. Each iteration refines your data quality, tightens your supplier relationships, and strengthens the assumption log that underpins your reporting. The guide to measuring event emissions step by step only becomes more efficient with repetition.
If the 200-person example in Step 4 is roughly the scale of your events, Green Passport Carbon’s calculator can produce an indicative footprint estimate in a fraction of the time this guide would take manually. That calculation is the starting point for a Full Event Carbon Assessment, credit retirement and a Green Passport Carbon certificate, and for a sustainability story your stakeholders will actually trust. Start your calculation with Green Passport Carbon.
Carbon neutral vs net zero: two terms, both sound green, both are...
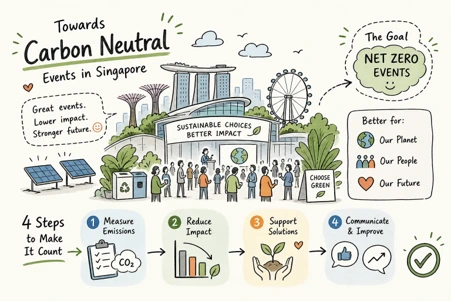
Carbon neutrality claims are increasingly visible in Singapore's events industry. Conference programmes...

Carbon offset solutions for hotel ballrooms and event spaces in Singapore are...
Find quick answers about the Event Carbon Calculator, your emissions estimate, and what happens next.
There is no official threshold. The most cited reference is approximately 14.13 kg CO2 per attendee for venue-related emissions, with energy the dominant contributor. Note this excludes attendee travel, so a full-scope per-attendee figure will typically be higher. Treat it as a comparative benchmark for the venue category rather than a pass mark for the whole event.
Yes. SACEOS has published WA 4: Sustainable MICE — Guidelines for Carbon Emissions Management, a Singapore Standards workspace agreement covering measurement, reduction, calculation, verification and offset. Separately, the Singapore MICE Sustainability Certification (MSC) provides GSTC-Recognised organisational certification, and STB and SACEOS will develop a MICE Decarbonisation Framework by 2028.
Air-conditioning, lighting and audiovisual systems run continuously through operating hours regardless of attendee behaviour, making venue energy a structural and relatively predictable load. In Singapore’s climate, cooling demand is both unavoidable and substantial. This is why the MICE Venue Sustainability Playbook points to emissions per square foot of venue area as a comparable metric.
Yes — and then raised them. By 2025 the original roadmap targets were exceeded, with all purpose-built MICE venues and over 80% of SACEOS member companies certified. Roadmap 2.0, unveiled in July 2026, commits to a MICE Decarbonisation Framework by 2028 and net zero by 2050.
No. MSC certifies the organisation across domains including carbon, waste, energy, water, social responsibility, HR competency and procurement, valid for two years. It does not produce a per-event footprint figure or evidence that a specific event’s emissions were addressed. Those are separate exercises.
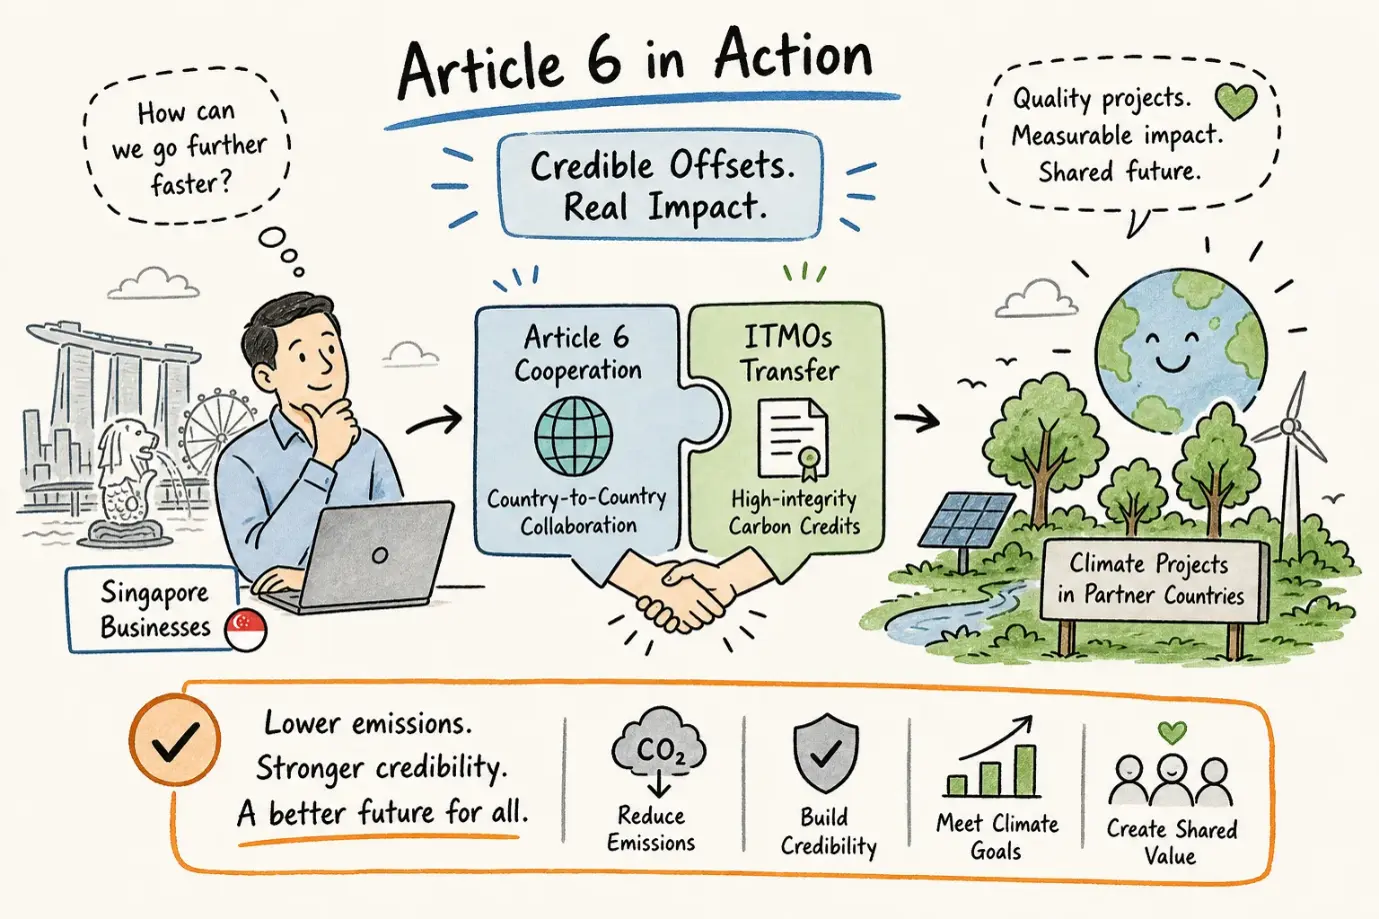
Article 6-aligned offsets are no longer just a conference talking point; they...
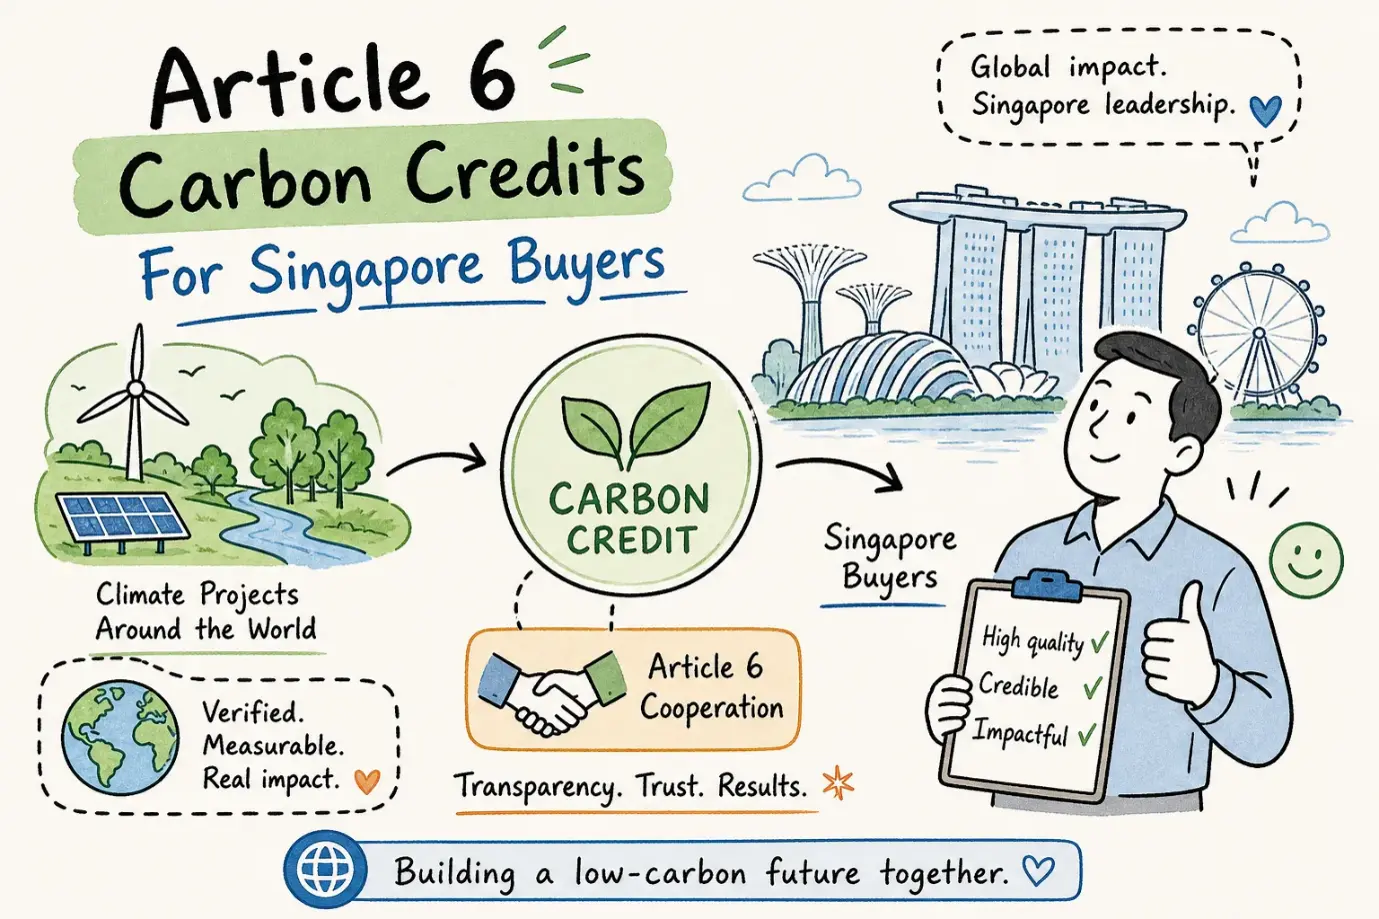
Article 6 carbon credits are fundamentally different from standard voluntary offsets, and...
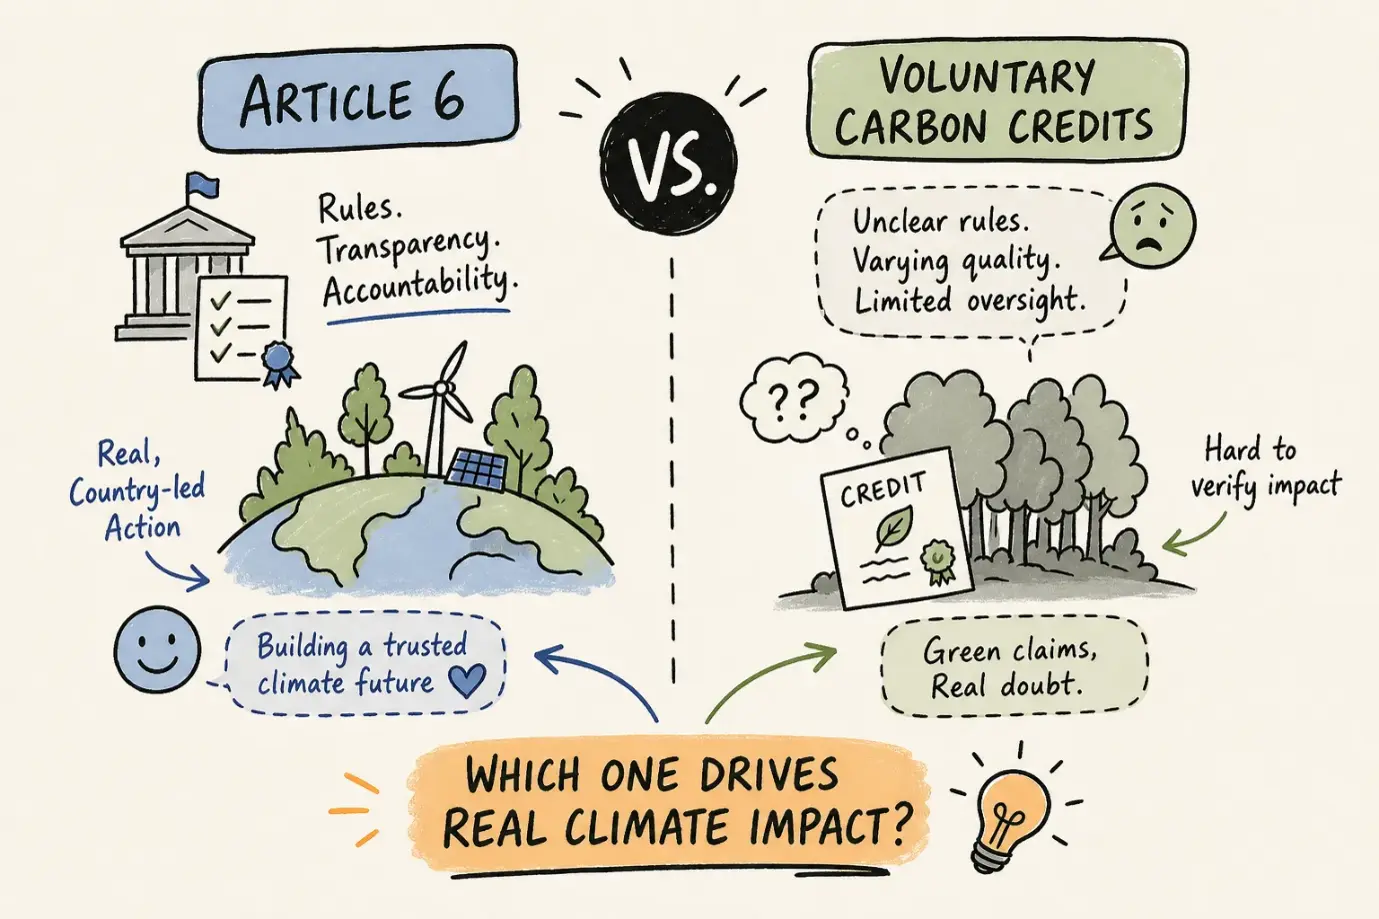
Understanding the difference between Article 6 and voluntary carbon market credits is...
Carbon neutral vs net zero: two terms, both sound green, both are...
For Singapore businesses, Article 6 carbon credits explained properly can mean the...
Carbon neutrality claims are increasingly visible in Singapore's events industry. Conference programmes...

Green Passport Carbon
Quick Links
More Information
 Optimized by Seraphinite Accelerator