
Carbon Offset Solutions for Singapore Hotel...
Carbon offset solutions for hotel ballrooms and event spaces in Singapore are...

Green Passport Carbon , Singapore


The CO2e figure for your conference has moved from a nice-to-have into a baseline expectation. Sponsors want to see it. Procurement teams require it before signing off on event budgets. ESG leads are embedding it in annual reports. For any serious event in Singapore, “we don’t track that” is no longer a credible answer. The good news is that once you know which five categories to measure and how to apply one formula consistently, the process of learning how to calculate the carbon footprint of a conference is far more straightforward than most organisers expect.
The methodology described here follows the principles of the GHG Protocol and ISO 14068-1, the internationally recognised carbon neutrality standard, which was revised in September 2026 as ISO 14068:2026. Green Passport Carbon’s own calculation approach is informed by these principles. This article walks through the formula, covers each emission category with real reference figures, builds a worked example for a 200-person regional conference, and shows you where a purpose-built tool removes the remaining friction.
The single biggest source of error in event carbon calculations is not the emission factors; it is inconsistent scope boundaries. Two organisers measuring an identical conference can produce very different CO2e totals if one includes delegate travel and the other does not. A standard conference scope boundary covers Scope 1 (direct fuel combustion at the venue), Scope 2 (purchased electricity), and the Scope 3 categories most relevant to events: delegate travel, accommodation, catering, purchased materials, and waste.
For most conferences, Scope 3 accounts for the overwhelming majority of total emissions. Delegate travel alone can represent 60 to 80% or more of the footprint, depending on how many attendees fly in. The GHG Protocol and ISO 14068-1 both require you to document your scope boundary before reporting any CO2e figure, so this step is non-negotiable.
Materiality is the deciding principle. An activity is material if excluding it would meaningfully change your total or mislead a reader. Delegate air travel is almost always material. Speaker freight for printed brochures is usually not. A practical rule of thumb: if excluding a category would shift your total by more than 1%, include it and document it. What matters most is applying a defensible, consistent threshold and recording your reasoning.
If an activity was procured specifically for the conference and would not have happened otherwise, it belongs inside your boundary. Venue electricity consumed during your event is in. The venue’s base building energy running overnight after your event wraps up is out. Applying this practical rule consistently across every category keeps your methodology defensible, treat it as a useful guide rather than a formal requirement from any single standard.
Every emission category uses the same structure. You take a measured activity, kilometres flown, kilowatt-hours consumed, kilograms of food served, and multiply it by a published emission factor expressed in kg CO2e per unit of that activity. The result is kg CO2e for that category. Sum all categories and you have your event total.
Total CO2e = (km × EF travel) + (kWh × EF electricity) + (kg food × EF food) + (kg waste × EF waste) + (room nights × EF hotel)
This is the same core equation you will use whether you are calculating with a spreadsheet or a purpose-built tool. Getting comfortable with it first makes every subsequent step easier to check and document.
Singapore’s Emissions Factors Registry (SEFR) is a useful source for local emission factors, including vehicle categories. For grid electricity, the Energy Market Authority’s Singapore Energy Statistics 2025 publishes a national grid emission factor of 0.402 kg CO2/kWh for 2024, the latest annual figure available as at October 2026. The worked example in this article uses this figure, but check which source and data year your specific reporting requirement calls for before finalising your methodology. Using a jurisdiction-specific factor matters: plugging in a UK grid figure for a Singapore venue would overstate electricity emissions by a meaningful margin.
Global Warming Potential (GWP) converts non-CO2 gases into CO2-equivalent units. For most event calculations, organisers use emission factors already expressed as CO2e, so GWP is applied for them inside the factor itself. The distinction becomes relevant when accounting for refrigerant leakage from venue HVAC systems, where the raw gas quantity needs to be multiplied by GWP before it enters your total.
Travel is almost always the largest emission source at a conference, which means it deserves the most careful treatment. The emission factor for aviation varies with route length because aircraft efficiency changes meaningfully between short and long sectors. For a regional conference drawing attendees from Southeast Asia, a practical planning assumption is that most flying delegates travel somewhere in the range of 500 to 2,500 km one-way, though your actual attendee origins should drive this figure wherever data is available.
Singapore-based aviation calculations use approximately 0.15 kg CO2e per passenger-km for short-haul international routes (under roughly 3,700 km, covering cities such as Bangkok, Bali, and Kuala Lumpur) and approximately 0.19 kg CO2e per passenger-km for long-haul routes. These figures are broadly consistent with commonly used published aviation factors; check the current values in your chosen source. Note that some methodologies apply a radiative forcing multiplier of around 1.7 to 1.9x to account for non-CO2 warming effects at altitude; check whether your reporting standard requires this. For a worked line item: 100 delegates flying an average of 1,200 km return at 0.15 kg CO2e per passenger-km produces 18,000 kg CO2e.
For local attendees, Singapore-specific factors from sources such as SEFR apply; indicatively, private hire vehicles and taxis run at approximately 0.16 kg CO2e per km, while the MRT sits at approximately 0.01 kg CO2e per passenger-km. The difference between a taxi and an MRT journey of the same distance is roughly 16 times, worth communicating clearly in your attendee travel guidance.
Two realistic approaches exist. A post-event travel survey asks attendees for their departure city, mode, and distance; this produces the most accurate data. A default model uses registered attendee countries or postcodes to estimate distances; this introduces more uncertainty but is far preferable to omitting travel entirely. Either method, documented clearly, can be defended under ISO 14068-1 principles.
Venue energy attributable to a single conference varies widely with hall size, hours and cooling load, so treat any benchmark with caution. As a reference point, STB’s baseline for Singapore’s six purpose-built MICE venues is 14.13 kg CO2 of venue-related emissions per attendee, with 94% from energy. Applying Singapore’s grid factor of 0.402 kg CO2/kWh, every 10,000 kWh adds about 4 tonnes CO2. The more accurate approach is to request an actual meter read from the venue for the event period; many Singapore convention centres and hotel ballrooms already track energy by event, so it is worth asking before defaulting to benchmarks.
Singapore hotels average roughly 22.5 to 24.5 kg CO2e per room-night across all hotel classes. For a three-day conference where 60% of 200 attendees stay onsite for two nights, the total room nights are 240 (200 × 0.6 × 2). Using a conservative benchmark of 20 kg CO2e per room-night, below the all-hotel average, appropriate if your delegates are concentrated in mid-range properties, the accommodation contribution is approximately 4,800 kg CO2e. Asking hotels for their reported energy intensity per guest night gives you a more precise figure than any average.
F&B emissions depend heavily on menu composition. A plant-forward meal carries roughly 0.5 to 1.0 kg CO2e per person, a mixed menu sits around 1.5 to 2.5 kg CO2e per person, and a red-meat-heavy banquet can reach 2.5 to 4.5 kg CO2e per person. Catering quantities and menu data are usually available from the caterer, making this one of the more data-rich categories to measure accurately once you decide to track it.
A defensible planning benchmark is 1.89 kg of waste generated per attendee per day, drawn from a published conference waste study. For a 200-person, one-day conference, this produces roughly 378 kg of waste. An emission factor of 0.5 kg CO2e per kg of waste is used in the worked example below as a provisional default; a more precise figure should be sourced from a jurisdiction-specific waste emissions reference for your final report. The CO2e contribution is typically minor relative to travel but still belongs in the boundary for reporting completeness.
Pulling all five categories together gives a realistic picture of how to calculate the carbon footprint of a conference, in this case, a 200-person, one-day event drawing attendees primarily from Southeast Asia.
| Category | Key assumption | Result (kg CO2e) |
|---|---|---|
| Flying delegates (150) | Average 1,200 km return at 0.15 kg CO2e/pax-km | 27,000 |
| Local attendees (50) | Mixed taxi/MRT; assumed average 12 km each way at blended modal split (see note) | ~400 |
| Venue energy | 7,000 kWh at EMA grid factor 0.402 kg CO2/kWh | 2,814 |
| Accommodation | 240 room-nights (200 × 60% × 2 nights) at 20 kg CO2e/night | 4,800 |
| Food and beverage | 200 attendees at 3 kg CO2e per person for the day (mixed menu, multiple meals and breaks) | 600 |
| Materials and waste | 378 kg waste (1.89 kg/attendee) at 0.5 kg CO2e/kg (provisional) | 189 |
Note on local attendees: the 400 kg CO2e estimate assumes an average one-way trip of approximately 12 km, with roughly 60% of local attendees travelling by taxi or private hire (0.16 kg CO2e/km) and 40% by MRT (0.01 kg CO2e/passenger-km). Adjust based on your actual venue location and attendee postcodes.
Total: approximately 35,803 kg CO2e, or roughly 179 kg CO2e per attendee.
In this example, delegate travel accounts for approximately 77% of the total, accommodation for about 13% and venue energy for about 8%. This is typical of conferences where most attendees fly in, even from within the region; for conferences with substantial long-haul international attendance, travel often accounts for an even larger share, because long-haul distances are much greater. The venue energy line assumes 7,000 kWh for the event, which is consistent in scale with STB’s per-attendee venue baseline; always request an actual meter read. The per-attendee figure of approximately 179 kg CO2e gives you a normalised metric that is genuinely useful for year-on-year comparisons, even as attendee numbers change between editions of the same event.
The worked example above is manageable for a one-off calculation. Rebuilding this model from scratch for each event, maintaining updated emission factors, and ensuring the methodology is documentable for an auditor adds up to a real and recurring burden for any team running multiple events per year.
A raw spreadsheet total is not the same as an audit-ready result. Audit-readiness means the methodology is documented, the emission factors are versioned and sourced, the scope boundary is recorded, and the calculation follows recognised standards such as the GHG Protocol and ISO 14068-1. Without this documentation, a CO2e figure cannot support a credible carbon neutrality claim or appear in a verified ESG report.
Green Passport Carbon’s conference carbon calculator covers flights, accommodation, electricity, food and beverages, and materials, using published emission factors. Organisers input their activity data and the calculator generates an indicative, categorised CO2e estimate they can act on immediately. The estimate is not by itself a final verified or certified footprint; teams can request a Full Event Carbon Assessment and, if they choose, move on to credit retirement and a branded Green Passport Carbon certificate, without building or maintaining the underlying model. Teams ready to move from raw data to a reportable figure can explore Green Passport Carbon’s calculator directly to see how the tool handles each category. The calculator itself is free and gives a Free Event Carbon Estimate; the Full Event Carbon Assessment, carbon-credit retirement and the Green Passport Carbon Event Certificate are provided as part of Green Passport Carbon’s quote-based service.
Knowing how to calculate the carbon footprint of a conference comes down to a five-category exercise built on one formula. Start with delegate travel because it drives a significant share of the total for most events, use Singapore-specific emission factors where available, and document your scope boundary before you publish any figure. A worked calculation for a typical 200-person regional conference in Singapore puts the total at roughly 30 to 40 tonnes CO2e, with delegate travel accounting for the bulk of it.
The per-attendee figure gives you a benchmark you can track and improve over time. A result that stands up to scrutiny, one that can support a carbon neutrality claim or feed into a sustainability report, requires documentation, sourced factors, and a recognised methodology behind it. That is where a purpose-built tool like Green Passport Carbon’s calculator offers the faster, more defensible path. The CO2e number is what you calculate; how rigorously you document and act on it is what separates a credible sustainability programme from a compliance checkbox.
Carbon offset solutions for hotel ballrooms and event spaces in Singapore are...
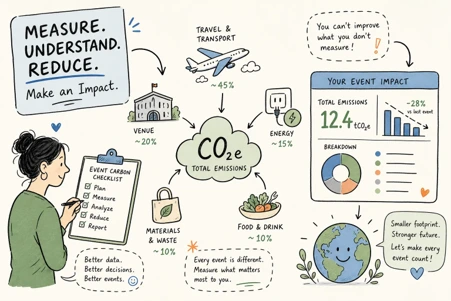
Most event organisers know they should be doing event carbon measurement. The...

Many venues now advertise a green event package Singapore corporate clients can...
Find quick answers about the Event Carbon Calculator, your emissions estimate, and what happens next.
There is no official threshold. The most cited reference is approximately 14.13 kg CO2 per attendee for venue-related emissions, with energy the dominant contributor. Note this excludes attendee travel, so a full-scope per-attendee figure will typically be higher. Treat it as a comparative benchmark for the venue category rather than a pass mark for the whole event.
Yes. SACEOS has published WA 4: Sustainable MICE — Guidelines for Carbon Emissions Management, a Singapore Standards workspace agreement covering measurement, reduction, calculation, verification and offset. Separately, the Singapore MICE Sustainability Certification (MSC) provides GSTC-Recognised organisational certification, and STB and SACEOS will develop a MICE Decarbonisation Framework by 2028.
Air-conditioning, lighting and audiovisual systems run continuously through operating hours regardless of attendee behaviour, making venue energy a structural and relatively predictable load. In Singapore’s climate, cooling demand is both unavoidable and substantial. This is why the MICE Venue Sustainability Playbook points to emissions per square foot of venue area as a comparable metric.
Yes — and then raised them. By 2025 the original roadmap targets were exceeded, with all purpose-built MICE venues and over 80% of SACEOS member companies certified. Roadmap 2.0, unveiled in July 2026, commits to a MICE Decarbonisation Framework by 2028 and net zero by 2050.
No. MSC certifies the organisation across domains including carbon, waste, energy, water, social responsibility, HR competency and procurement, valid for two years. It does not produce a per-event footprint figure or evidence that a specific event’s emissions were addressed. Those are separate exercises.
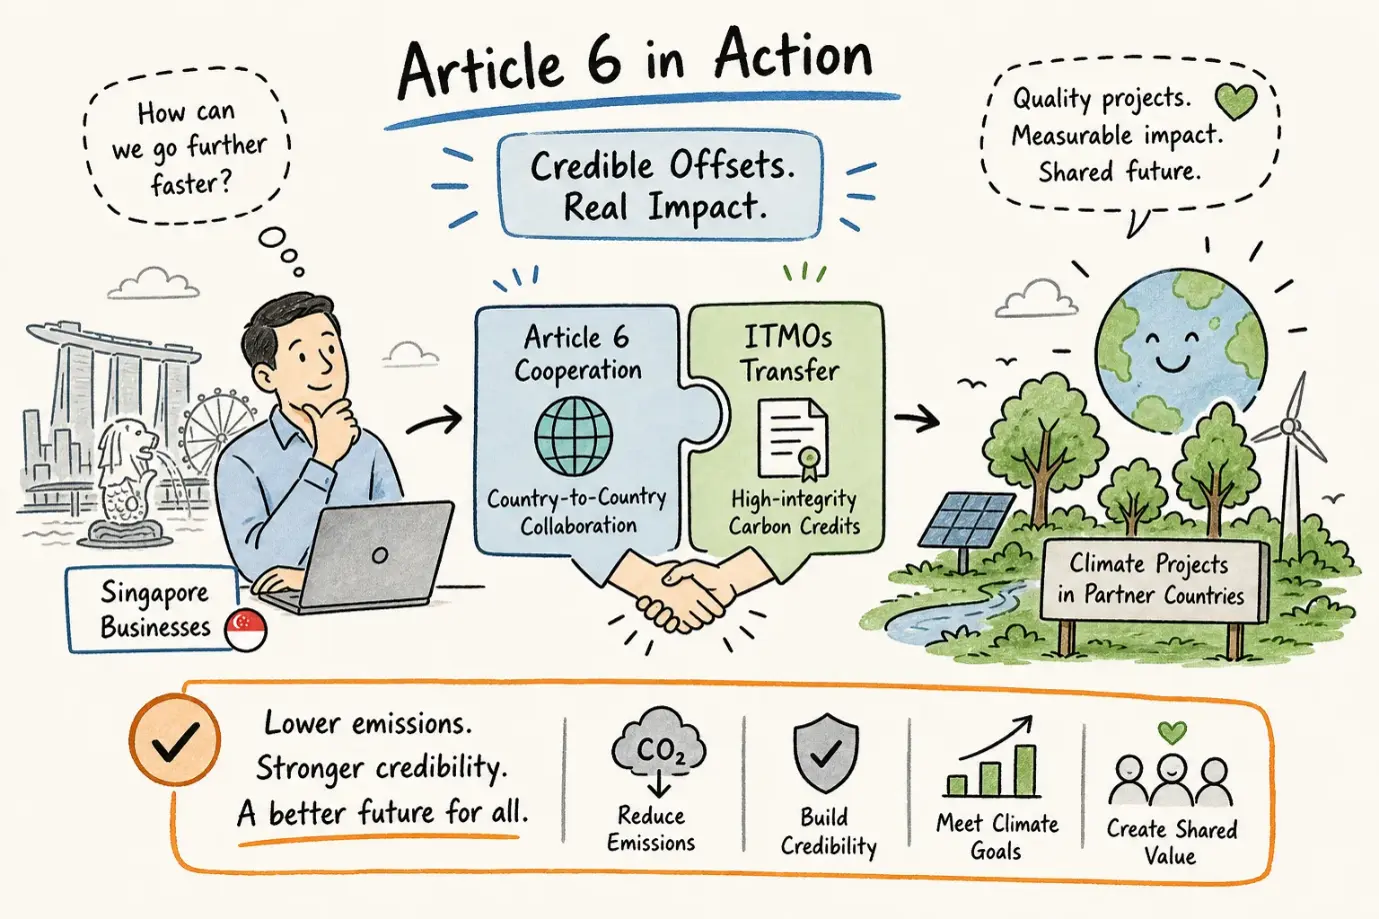
Article 6-aligned offsets are no longer just a conference talking point; they...

Article 6 carbon credits are fundamentally different from standard voluntary offsets, and...
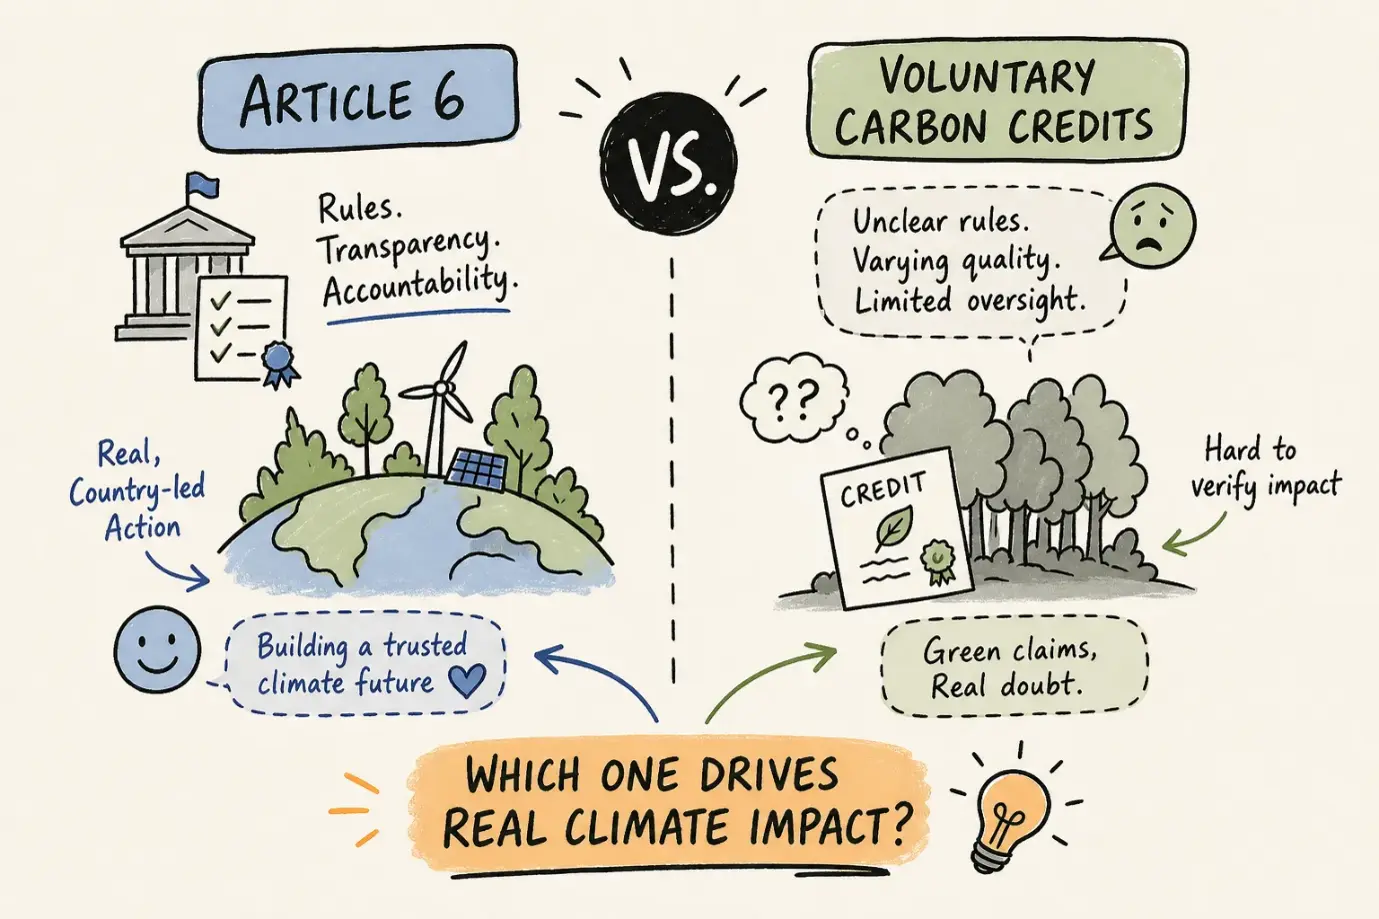
Understanding the difference between Article 6 and voluntary carbon market credits is...
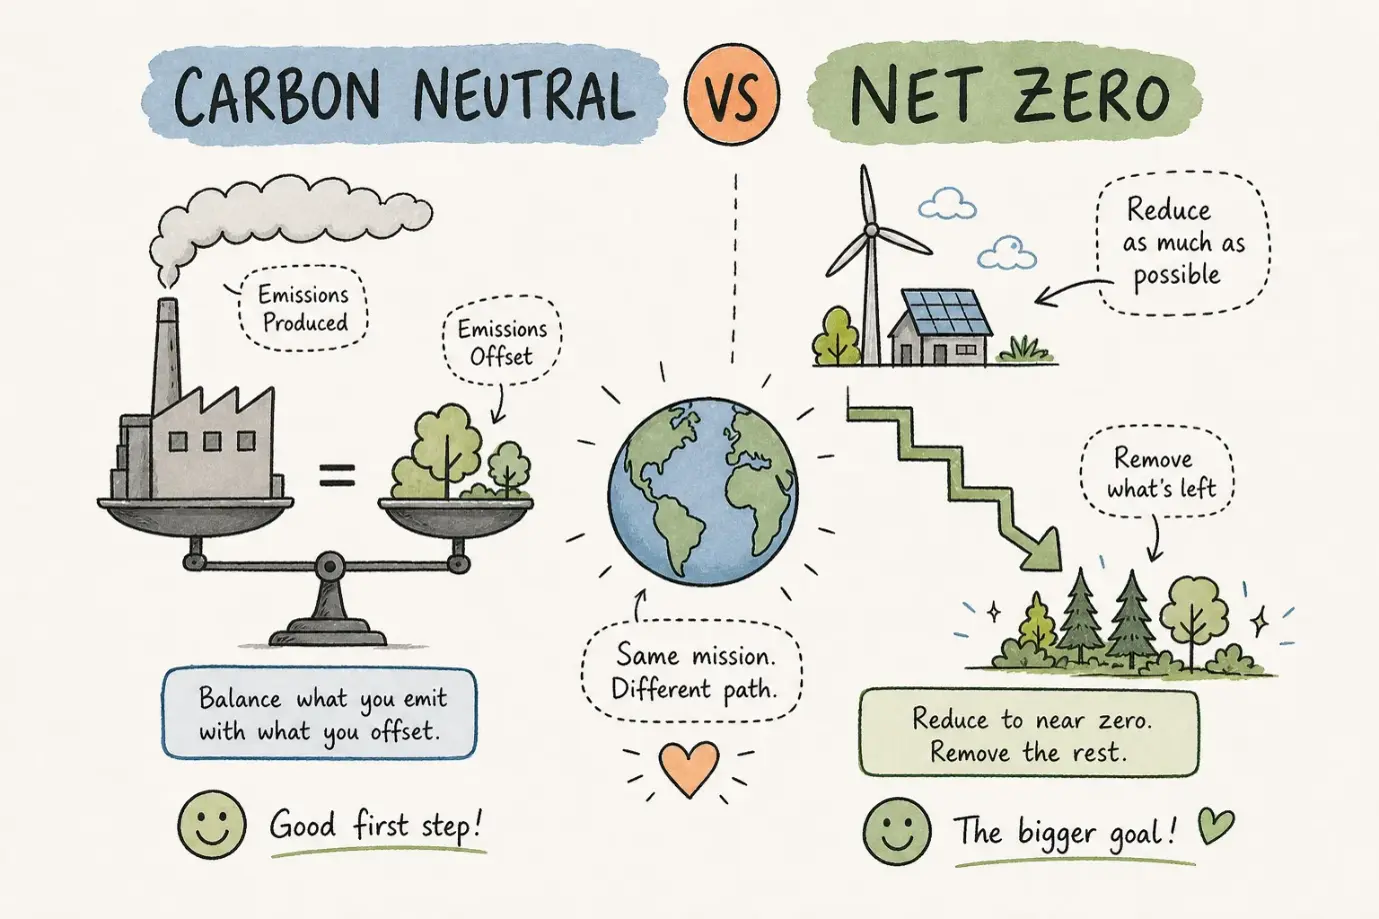
Carbon neutral vs net zero: two terms, both sound green, both are...

For Singapore businesses, Article 6 carbon credits explained properly can mean the...
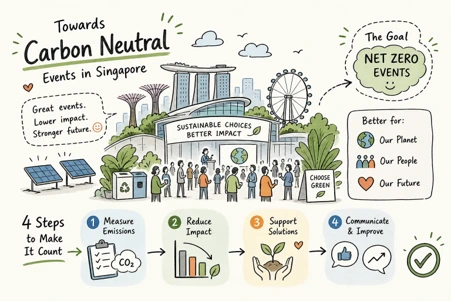
Carbon neutrality claims are increasingly visible in Singapore's events industry. Conference programmes...

Green Passport Carbon
Quick Links
More Information
 Optimized by Seraphinite Accelerator